Supplementary Information for "HTS
advertisement
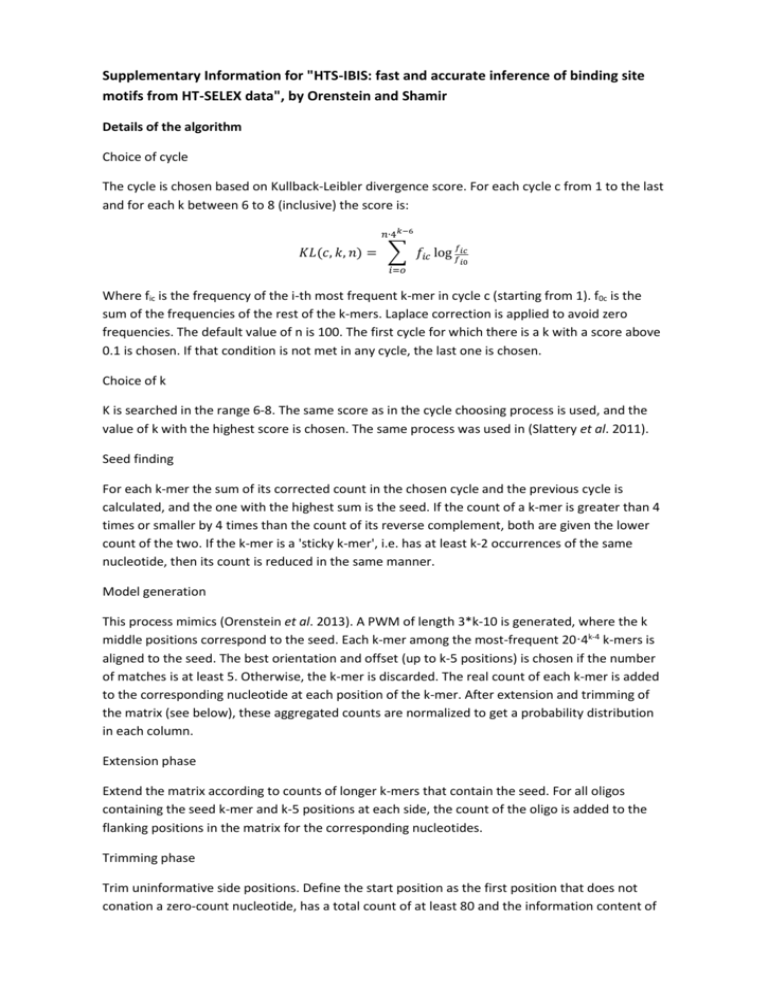
Supplementary Information for "HTS-IBIS: fast and accurate inference of binding site motifs from HT-SELEX data", by Orenstein and Shamir Details of the algorithm Choice of cycle The cycle is chosen based on Kullback-Leibler divergence score. For each cycle c from 1 to the last and for each k between 6 to 8 (inclusive) the score is: 𝑛∙4𝑘−6 𝐾𝐿(𝑐, 𝑘, 𝑛) = ∑ 𝑓𝑖𝑐 log 𝑓𝑓𝑖𝑐 𝑖=𝑜 𝑖0 Where fic is the frequency of the i-th most frequent k-mer in cycle c (starting from 1). f0c is the sum of the frequencies of the rest of the k-mers. Laplace correction is applied to avoid zero frequencies. The default value of n is 100. The first cycle for which there is a k with a score above 0.1 is chosen. If that condition is not met in any cycle, the last one is chosen. Choice of k K is searched in the range 6-8. The same score as in the cycle choosing process is used, and the value of k with the highest score is chosen. The same process was used in (Slattery et al. 2011). Seed finding For each k-mer the sum of its corrected count in the chosen cycle and the previous cycle is calculated, and the one with the highest sum is the seed. If the count of a k-mer is greater than 4 times or smaller by 4 times than the count of its reverse complement, both are given the lower count of the two. If the k-mer is a 'sticky k-mer', i.e. has at least k-2 occurrences of the same nucleotide, then its count is reduced in the same manner. Model generation This process mimics (Orenstein et al. 2013). A PWM of length 3*k-10 is generated, where the k middle positions correspond to the seed. Each k-mer among the most-frequent 20·4k-4 k-mers is aligned to the seed. The best orientation and offset (up to k-5 positions) is chosen if the number of matches is at least 5. Otherwise, the k-mer is discarded. The real count of each k-mer is added to the corresponding nucleotide at each position of the k-mer. After extension and trimming of the matrix (see below), these aggregated counts are normalized to get a probability distribution in each column. Extension phase Extend the matrix according to counts of longer k-mers that contain the seed. For all oligos containing the seed k-mer and k-5 positions at each side, the count of the oligo is added to the flanking positions in the matrix for the corresponding nucleotides. Trimming phase Trim uninformative side positions. Define the start position as the first position that does not conation a zero-count nucleotide, has a total count of at least 80 and the information content of the next position is at least 0.1. If no such position exists and the core starts at positions i, return i+2. The information content for vector (v1, v2, v3, v4) (where i vi = 1) is defined as 2+i vi log(vi). The end position is determined analogously. Performance evaluation Seed finding evaluation We evaluated the seed finding process by comparing it to two gold-standards. The chosen seed is compared to (i) the top-ranking 8-mer in a PBM experiment on the same protein; (ii) the published seeds in (Jolma et al. 2013). If the chosen seed fits the gold standard in offset up to two with at most two mismatches, then it is considered a match. In the cases where Jolma et al. provided several seeds, a fit to one of them is enough to declare it a match. When there were several PBM experiments on the same TF, an arbitrary PBM experiment on the same protein was paired to each HT-SELEX experiment (a total of 237 paired experiments). The number of HT-SELEX experiments is 547. Binding prediction evaluation We tested the accuracy of models inferred by each method in predicting in vitro and in vivo binding. In vitro binding was measured on PBM experiments (Robasky and Bulyk 2011) and in vivo on ChIP-seq experiments (Landt et al. 2012). The model, in PWM format, was used to rank all PBM probe sequences or ChIP-seq peaks in an experiment on the same protein. For each sequence an occupancy score was calculated, which is the sum of the probability of the protein to bind over all positions (Tanay 2006). This score is used to rank all sequences. For sequence s and PWM Θ of length k, the occupancy score is f (s, ) t 0 | s| k k i 1 i [st i ] Where Θi(x) is the probability of base x in position i of the PWM. The ranking due to the occupancy score is compared to the original ranking according to the binding intensity. The positive set in PBM is selected as in (Chen et al. 2007); all other probes are the negative set. The top 500 peaks were considered the positive set, and sequences of the same length 300-bp downstream composed the negative set. For each peak, the 250bp around its center was used. A model inferred from an HT-SELEX experiment was tested on all PBM experiments on the same TF (a total of 344 paired experiments) and all ChIP-seq experiments on the same TF (a total of 59 paired experiments). For each PBM experiment, the AUC is reported. When there are several ChIP-seq experiments on the same TF, the average AUC is reported. Implementation details The method is implemented efficiently in Java. Each nucleotide is coded by 2 bits. K-mers of the maximum k (8) are counted, and counts of lower k-mers are derived from these counts. When run on machine with a single core of an Intel Xeon CPU E5410 @2.33 GHz with 6 MB of cache and 16 GB of memory typical running time is ≤5 seconds and typical amount of peak memory usage is 2.5 MB. References Chen X, Hughes TR, Morris Q. 2007. RankMotif++: a motif-search algorithm that accounts for relative ranks of K-mers in binding transcription factors. Bioinformatics 23(13): i72-79. Jolma A, Yan J, Whitington T, Toivonen J, Nitta KR, Rastas P, Morgunova E, Enge M, Taipale M, Wei G et al. 2013. DNA-binding specificities of human transcription factors. Cell 152(1-2): 327-339. Landt SG, Marinov GK, Kundaje A, Kheradpour P, Pauli F, Batzoglou S, Bernstein BE, Bickel P, Brown JB, Cayting P et al. 2012. ChIP-seq guidelines and practices of the ENCODE and modENCODE consortia. Genome Res 22(9): 1813-1831. Orenstein Y, Mick E, Shamir R. 2013. RAP: accurate and fast motif finding based on proteinbinding microarray data. J Comput Biol 20(5): 375-382. Robasky K, Bulyk ML. 2011. UniPROBE, update 2011: expanded content and search tools in the online database of protein-binding microarray data on protein-DNA interactions. Nucleic Acids Res 39(Database issue): D124-128. Slattery M, Riley T, Liu P, Abe N, Gomez-Alcala P, Dror I, Zhou T, Rohs R, Honig B, Bussemaker HJ et al. 2011. Cofactor binding evokes latent differences in DNA binding specificity between Hox proteins. Cell 147(6): 1270-1282. Tanay A. 2006. Extensive low-affinity transcriptional interactions in the yeast genome. Genome Res 16(8): 962-972.
