Computer Applications in Chemical Engineering

Computer Applications in Chemical Engineering
Assignment No. 12 – Write Your Own Visual Basic Program
Due at the end of your lab period.
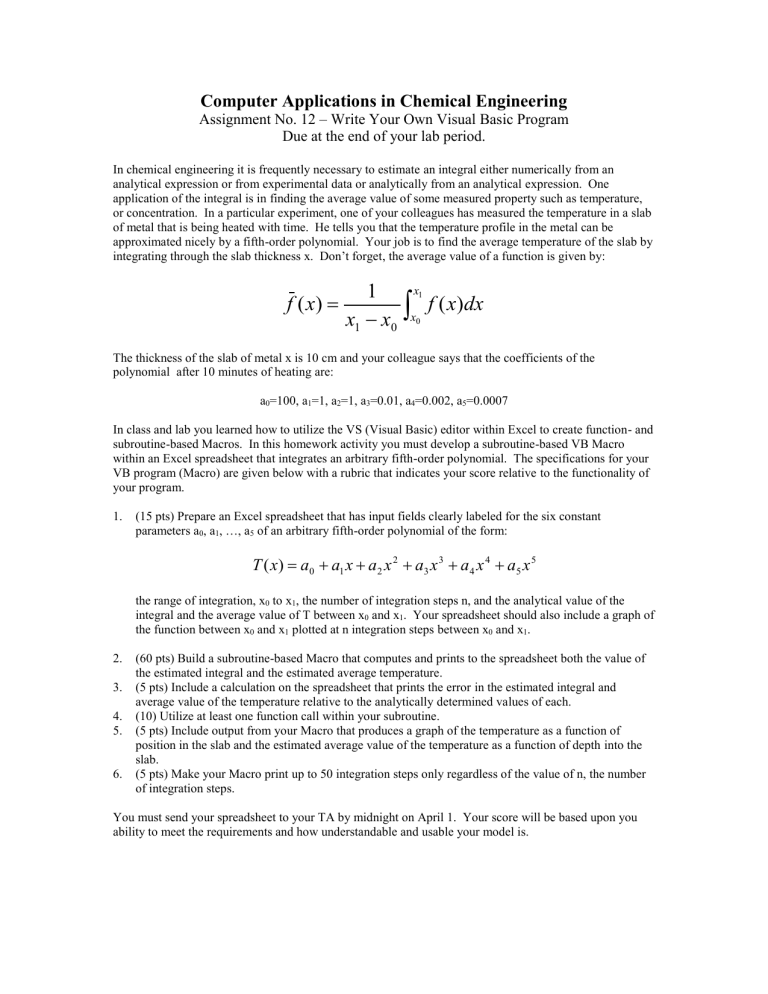
In chemical engineering it is frequently necessary to estimate an integral either numerically from an analytical expression or from experimental data or analytically from an analytical expression. One application of the integral is in finding the average value of some measured property such as temperature, or concentration. In a particular experiment, one of your colleagues has measured the temperature in a slab of metal that is being heated with time. He tells you that the temperature profile in the metal can be approximated nicely by a fifth-order polynomial. Your job is to find the average temperature of the slab by integrating through the slab thickness x. Don’t forget, the average value of a function is given by: f ( x )
x
1
1
x
0
x
1 x
0 f ( x ) dx
The thickness of the slab of metal x is 10 cm and your colleague says that the coefficients of the polynomial after 10 minutes of heating are: a
0
=100, a
1
=1, a
2
=1, a
3
=0.01, a
4
=0.002, a
5
=0.0007
In class and lab you learned how to utilize the VS (Visual Basic) editor within Excel to create function- and subroutine-based Macros. In this homework activity you must develop a subroutine-based VB Macro within an Excel spreadsheet that integrates an arbitrary fifth-order polynomial. The specifications for your
VB program (Macro) are given below with a rubric that indicates your score relative to the functionality of your program.
1.
(15 pts) Prepare an Excel spreadsheet that has input fields clearly labeled for the six constant parameters a
0
, a
1
, …, a
5
of an arbitrary fifth-order polynomial of the form:
T ( x )
a
0
a
1 x
a
2 x
2 a
3 x
3 a
4 x
4 a
5 x
5 the range of integration, x
0
to x
1
, the number of integration steps n, and the analytical value of the integral and the average value of T between x
0
and x
1
. Your spreadsheet should also include a graph of the function between x
0
and x
1
plotted at n integration steps between x
0
and x
1
.
2.
(60 pts) Build a subroutine-based Macro that computes and prints to the spreadsheet both the value of the estimated integral and the estimated average temperature.
3.
(5 pts) Include a calculation on the spreadsheet that prints the error in the estimated integral and average value of the temperature relative to the analytically determined values of each.
4.
(10) Utilize at least one function call within your subroutine.
5.
(5 pts) Include output from your Macro that produces a graph of the temperature as a function of position in the slab and the estimated average value of the temperature as a function of depth into the slab.
6.
(5 pts) Make your Macro print up to 50 integration steps only regardless of the value of n, the number of integration steps.
You must send your spreadsheet to your TA by midnight on April 1. Your score will be based upon you ability to meet the requirements and how understandable and usable your model is.


