Making Climate Graphs
advertisement

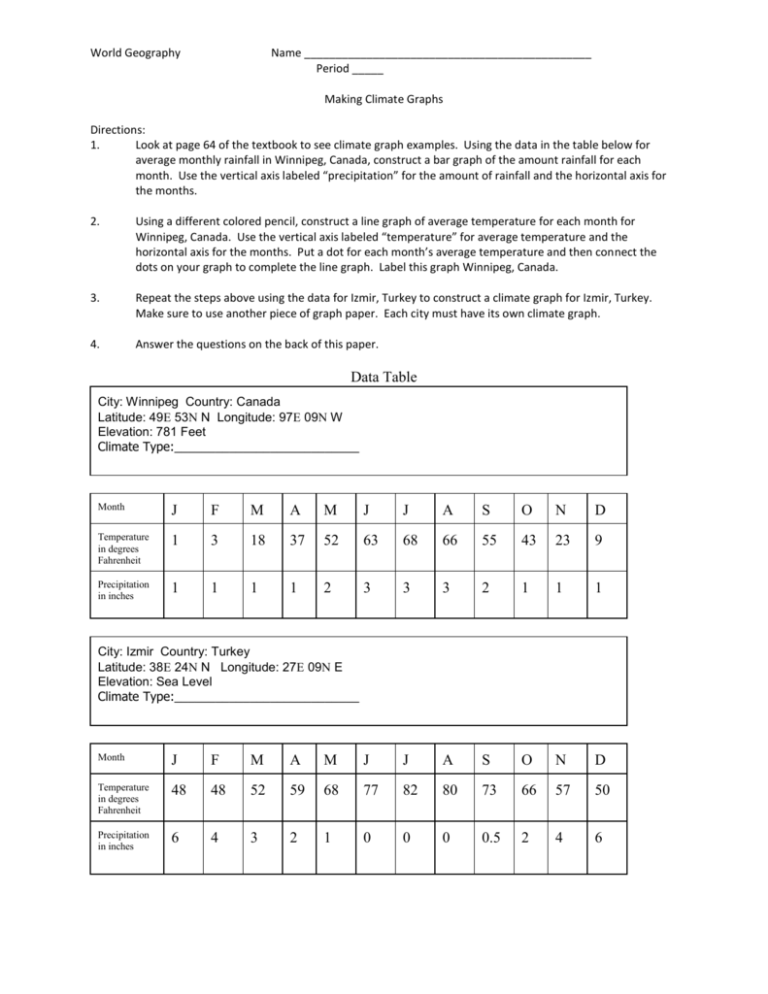
World Geography Name ______________________________________________ Period _____ Making Climate Graphs Directions: 1. Look at page 64 of the textbook to see climate graph examples. Using the data in the table below for average monthly rainfall in Winnipeg, Canada, construct a bar graph of the amount rainfall for each month. Use the vertical axis labeled “precipitation” for the amount of rainfall and the horizontal axis for the months. 2. Using a different colored pencil, construct a line graph of average temperature for each month for Winnipeg, Canada. Use the vertical axis labeled “temperature” for average temperature and the horizontal axis for the months. Put a dot for each month’s average temperature and then connect the dots on your graph to complete the line graph. Label this graph Winnipeg, Canada. 3. Repeat the steps above using the data for Izmir, Turkey to construct a climate graph for Izmir, Turkey. Make sure to use another piece of graph paper. Each city must have its own climate graph. 4. Answer the questions on the back of this paper. Data Table City: Winnipeg Country: Canada Latitude: 49 53 N Longitude: 97 09 W Elevation: 781 Feet Climate Type:___________________________ Month J F M A M J J A S O N D Temperature in degrees Fahrenheit 1 3 18 37 52 63 68 66 55 43 23 9 Precipitation in inches 1 1 1 1 2 3 3 3 2 1 1 1 City: Izmir Country: Turkey Latitude: 38 24 N Longitude: 27 09 E Elevation: Sea Level Climate Type:___________________________ Month J F M A M J J A S O N D Temperature in degrees Fahrenheit 48 48 52 59 68 77 82 80 73 66 57 50 Precipitation in inches 6 4 3 2 1 0 0 0 0.5 2 4 6 1. Which city has the highest winter temperatures? _______________ The lowest? ___________ 2. Which city has the greatest range of temperature from winter to summer? ________________ Which has the smallest range? ________________________________ 3. Which city has the driest summer? ________________ The wettest? ____________________ 4. Which city has the driest winter? _________________ The wettest? ____________________ Look at the map on pp. 60-61 to help you answer the following questions: 5. What climate type does Winnipeg have? __________________________________________ 6. What climate type does Izmir have? ______________________________________________ 7. Write a paragraph comparing the climate of Winnipeg with the climate of Izmir: __________ _________________________________________________________________ _________________________________________________________________ _________________________________________________________________ _________________________________________________________________ _________________________________________________________________ _________________________________________________________________


