Exam 3c
advertisement
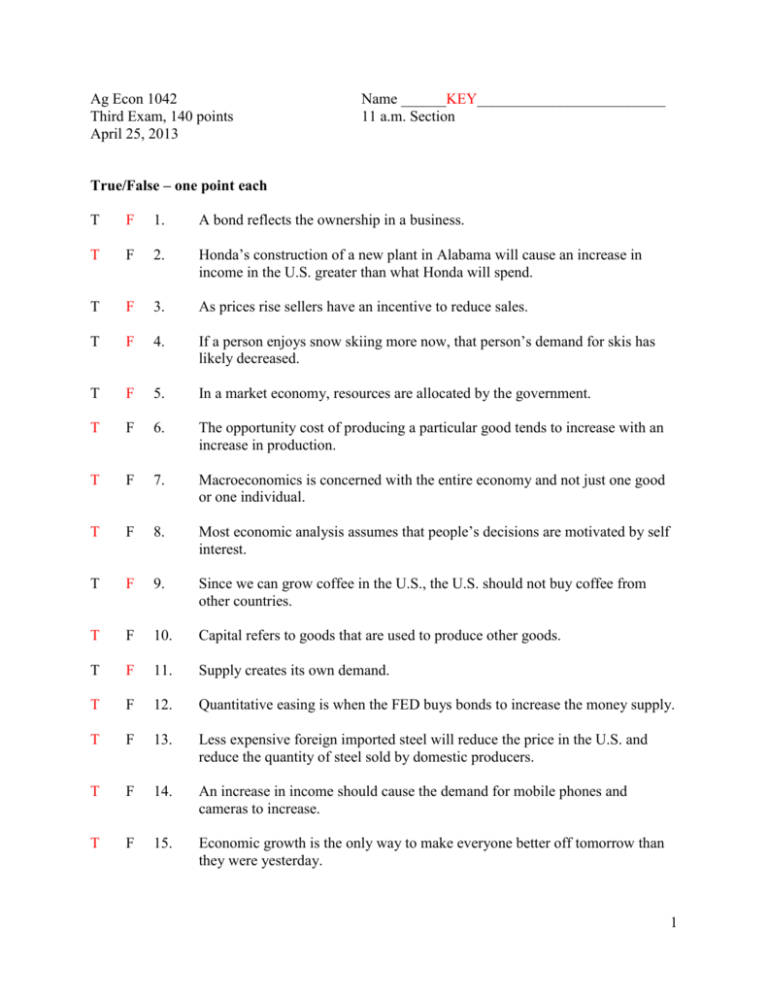
Ag Econ 1042 Third Exam, 140 points April 25, 2013 Name ______KEY_________________________ 11 a.m. Section True/False – one point each T F 1. A bond reflects the ownership in a business. T F 2. Honda’s construction of a new plant in Alabama will cause an increase in income in the U.S. greater than what Honda will spend. T F 3. As prices rise sellers have an incentive to reduce sales. T F 4. If a person enjoys snow skiing more now, that person’s demand for skis has likely decreased. T F 5. In a market economy, resources are allocated by the government. T F 6. The opportunity cost of producing a particular good tends to increase with an increase in production. T F 7. Macroeconomics is concerned with the entire economy and not just one good or one individual. T F 8. Most economic analysis assumes that people’s decisions are motivated by self interest. T F 9. Since we can grow coffee in the U.S., the U.S. should not buy coffee from other countries. T F 10. Capital refers to goods that are used to produce other goods. T F 11. Supply creates its own demand. T F 12. Quantitative easing is when the FED buys bonds to increase the money supply. T F 13. Less expensive foreign imported steel will reduce the price in the U.S. and reduce the quantity of steel sold by domestic producers. T F 14. An increase in income should cause the demand for mobile phones and cameras to increase. T F 15. Economic growth is the only way to make everyone better off tomorrow than they were yesterday. 1 T F 16. Price is a measure of scarcity. T F 17. We attempt to make ourselves better off by trade regardless if we are a buyer or seller. T F 18. We want to choose the option with the lowest opportunity cost. T F 19. Demand for a specific good is a set of price-quantity combinations. T F 20. The supply curve represents the lowest opportunity cost quantity that is made available by sellers at each price. T F 21. An increase in spending on highways and education will immediately increase aggregate demand and should eventually cause an additional increase in aggregate demand as well as an increase in aggregate supply. T F 22. Inflation creates an increase in purchasing power for the holders of money. T F 23. Automatic stabilizers counter fluctuations in the business cycle without legislative action. T F 24. The U.S. Treasury issues bonds to borrow for the U.S. government. T F 25. Money is a medium of exchange. T F 26. Money is often held to facilitate transactions. T F 27. The Federal Reserves’ independence from the political process allows it to focus on what is best for the entire nation. T F 28. The marginal tax rate will be lower than the average tax rate if the tax is progressive. T F 29. The FED attempts to keep the price level relatively stable by affecting the money supply. T F 30. The FED controls the money supply through it use of fiscal policy. 2 Multiple choice – two points each __a___ 31. When government outlays exceed tax receipts, the situation is called a budget a) Deficit b) Surplus c) Debt d) With no balance e) None of the above __b___ 32. An increase in taxes should be applied in a situation when there is a) A recession b) Inflation c) High unemployment d) Low demand for goods and services e) No tax multiplier __c___ 33. Which of the following can change without shifting the demand curve? a) Increase in income b) Utility (the benefit gained in whatever form) c) The price of the good itself d) A change in the price of other goods e) Expectations of less income __d___ 34. Quantitative easing (money creation by the FED) a) Is supported by everyone b) Is supported by no one c) Has created current problems for the U.S. economy d) The current case has no true historical precedent e) None of the above __e___ 35. The federal budget is a) About $3.5T b) In deficit by nearly $1T c) May be lower for the first time in over 50 years d) A tool of fiscal policy e) All of the above __d___ 36. Demand-pull inflation a) Can be caused by increases in aggregate demand b) Can result from expansionary fiscal policy c) Can reduce growth due to higher prices d) All of the above e) None of the above 3 __e___ 37. Discouraged workers a) Have left the labor force b) Cause the official unemployment rate to understate high unemployment c) Cause the official unemployment rate to overstate low unemployment d) Say they are willing to work but are not looking for jobs e) All of the above __c___ 38. Which of the following statements about money is true? a) It has an upward sloping demand curve b) It is mostly created by Congress c) It serves as a medium of exchange d) It is seldom used to measure value e) All of the above are true __b___ 39. A rightward shift in the aggregate supply curve might best be explained by a) An increase in business taxes b) An increase in productivity c) An increase in nominal wages d) An increase in the price of imported resources e) All of the above __d___ 40. The circular flow model is used to show the a) Flow of renewable natural resources b) Recycling process of production materials c) Expansions and contractions of the economic activity d) Flow of expenditures and income in the economy e) Flow of supply and the flow of demand 4 Matching – one point each U 41. Price level A. Buying and selling of bonds by FED X 42. Trough B. Value of a country’s output Y 43. Consumer surplus C. Wants exceed resources B 44. GDP D. Open market operations to increase money supply W 45. Opportunity cost E. Output/worker K 46. Debt F. Gross income S 47. Fiscal policy G. Profits increase this H 48. Frictional unemployment H. Worker created D 49. Quantitative easing I. Bank to bank interest rate G 50. Investment J. All expenditures possible in economy R 51. Interest rates K. Accumulated deficits minus surpluses A 52. Open market operations L. A situation that is currently stable L 53. Equilibrium M. Willingness and ability to sell at various prices M 54. Supply N. U.S. national bank P 55. Net exports O. A recurring situation for a nation’s output Q 56. Resources P. Exports minus imports T 57. Inflation Q. Inputs F 58. Revenue R. Price of money I 59. Federal Funds rate S. Taxation and government spending O 60. Business cycle T. Increase in overall price level E 61. Productivity U. Measured with price index N 62. Federal Reserve V. Economic growth time period C 63. Scarcity W. What exists with every decision J 64. Aggregate demand X. Bottom of cycle V 65. Expansion Y. Net value from a market for buyers 5 Short answers are valued at 5 points each 66. The U.S. government is _____spending______________ more than it takes in through ____taxes___________________. 67. What can the FED do if it wants to increase GDP in the short run? Buy bonds; lower interest rates 5 pts Increase money supply 4 pts 68. Diagram the result of higher tomato costs in the market for salsa. Show final consumer and producer surplus. S1 P S CS P1 P0 PS D 0 Q1 Q0 Q 69. Show with a diagram what likely would have happened in the U.S. if the FED had not followed quantitative easing policies. PL AS PL0 PL1 AD AD1 0 Q1 Q0 rGDP 6 70. Why would the city of Columbia, for its own fiscal purposes, want to invest in an industrial part that would be located south of the city but north of the local airport? Multiplier would increase total (revenue, income, taxes – any ok) 71. If consumer confidence increases this month, what does this suggest would happen in the U.S. economy? Use a diagram (graph). PL AS PL1 PL0 AD 0 Q0 Q1 AD1 rGDP 72. Why is structural unemployment necessary to preserve economic growth? To adopt new technologies (& strategies) 73. What would the total impact of an increase in government expenditures (X) be on the economy? (X) x multiplier = total impact 74. What is the concern with having lots of money in circulation? Inflation (potential) 75. What two components were the primary reasons for increased GDP in the first quarter? C&I 7 76. What is the CPI? What does it help measure? Consumer Price Index; Inflation (or price level) 77. The FED wants to stimulate the economy. Identify two ways the FED can attempt to speed economic growth through expansionary policy. Buy bonds Lower interest rates 78. Draw the standard AS & AD macroeconomic model showing the changes that have taken place during the last six months. PL AS AS1 PL1 PL0 AD 0 Q0 Q1 AD1 rGDP 8

