Paper Title
advertisement
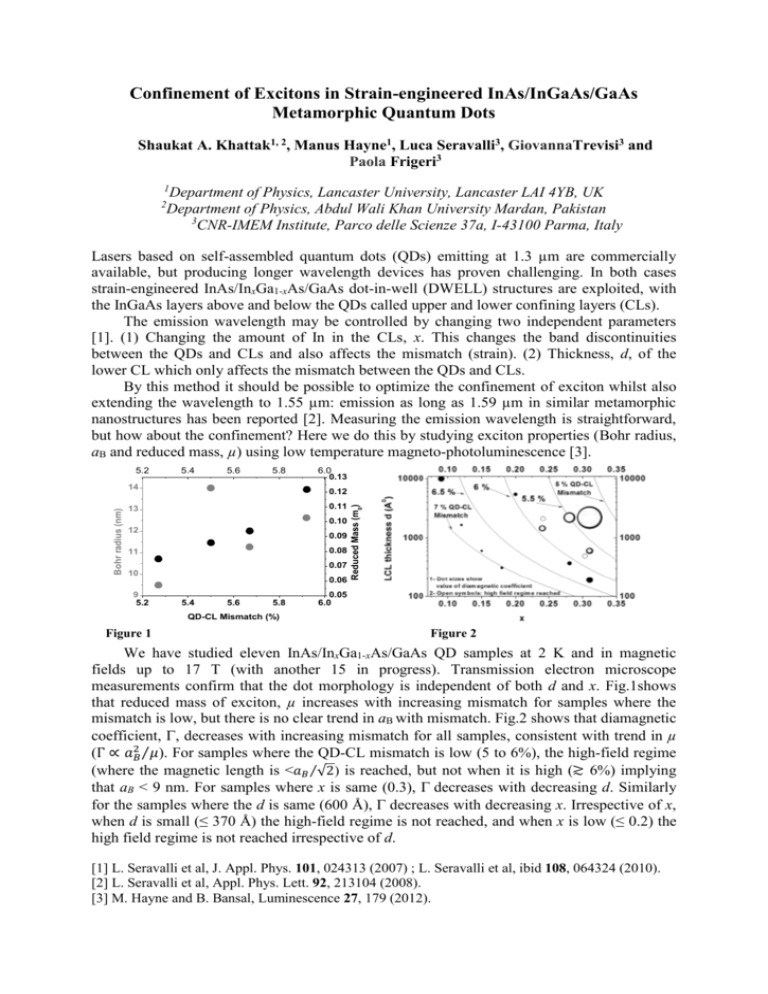
Confinement of Excitons in Strain-engineered InAs/InGaAs/GaAs Metamorphic Quantum Dots Shaukat A. Khattak1, 2, Manus Hayne1, Luca Seravalli3, GiovannaTrevisi3 and Paola Frigeri3 1 2 Department of Physics, Lancaster University, Lancaster LAI 4YB, UK Department of Physics, Abdul Wali Khan University Mardan, Pakistan 3 CNR-IMEM Institute, Parco delle Scienze 37a, I-43100 Parma, Italy Lasers based on self-assembled quantum dots (QDs) emitting at 1.3 µm are commercially available, but producing longer wavelength devices has proven challenging. In both cases strain-engineered InAs/InxGa1-xAs/GaAs dot-in-well (DWELL) structures are exploited, with the InGaAs layers above and below the QDs called upper and lower confining layers (CLs). The emission wavelength may be controlled by changing two independent parameters [1]. (1) Changing the amount of In in the CLs, x. This changes the band discontinuities between the QDs and CLs and also affects the mismatch (strain). (2) Thickness, d, of the lower CL which only affects the mismatch between the QDs and CLs. By this method it should be possible to optimize the confinement of exciton whilst also extending the wavelength to 1.55 µm: emission as long as 1.59 µm in similar metamorphic nanostructures has been reported [2]. Measuring the emission wavelength is straightforward, but how about the confinement? Here we do this by studying exciton properties (Bohr radius, aB and reduced mass, µ) using low temperature magneto-photoluminescence [3]. 5.4 5.6 5.8 Bohr radius (nm) 6.0 0.13 0.12 0.11 13 0.10 12 0.09 0.08 11 0.07 10 9 5.2 0.06 5.4 5.6 5.8 Reduced Mass (m0) 5.2 14 0.05 6.0 QD-CL Mismatch (%) Figure 1 Figure 2 We have studied eleven InAs/InxGa1-xAs/GaAs QD samples at 2 K and in magnetic fields up to 17 T (with another 15 in progress). Transmission electron microscope measurements confirm that the dot morphology is independent of both d and x. Fig.1shows that reduced mass of exciton, µ increases with increasing mismatch for samples where the mismatch is low, but there is no clear trend in aB with mismatch. Fig.2 shows that diamagnetic coefficient, , decreases with increasing mismatch for all samples, consistent with trend in µ (Γ ∝ 𝑎𝐵2 ⁄𝜇 ). For samples where the QD-CL mismatch is low (5 to 6%), the high-field regime (where the magnetic length is <𝑎𝐵 ⁄√2) is reached, but not when it is high (≳ 6%) implying that aB < 9 nm. For samples where x is same (0.3), decreases with decreasing d. Similarly for the samples where the d is same (600 Å), decreases with decreasing x. Irrespective of x, when d is small (≤ 370 Å) the high-field regime is not reached, and when x is low (≤ 0.2) the high field regime is not reached irrespective of d. [1] L. Seravalli et al, J. Appl. Phys. 101, 024313 (2007) ; L. Seravalli et al, ibid 108, 064324 (2010). [2] L. Seravalli et al, Appl. Phys. Lett. 92, 213104 (2008). [3] M. Hayne and B. Bansal, Luminescence 27, 179 (2012).
