Trigonometric Functions Assignment: Grade 11 Math
advertisement
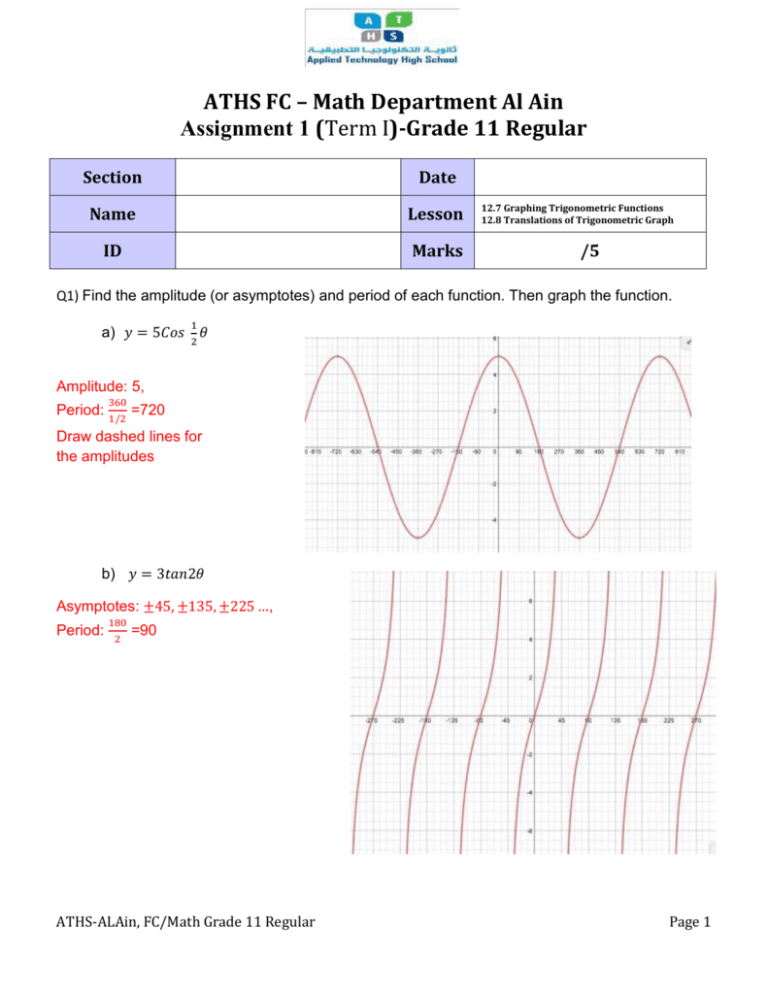
ATHS FC – Math Department Al Ain Assignment 1 (Term I)-Grade 11 Regular Section Date Name Lesson ID Marks 12.7 Graphing Trigonometric Functions 12.8 Translations of Trigonometric Graph /5 Q1) Find the amplitude (or asymptotes) and period of each function. Then graph the function. 1 a) 𝑦 = 5𝐶𝑜𝑠 2 𝜃 Amplitude: 5, Period: 360 1/2 =720 Draw dashed lines for the amplitudes b) 𝑦 = 3𝑡𝑎𝑛2𝜃 Asymptotes: ±45, ±135, ±225 …, Period: 180 2 =90 ATHS-ALAin, FC/Math Grade 11 Regular Page 1 Q2) State the amplitude, period, phase shift, and vertical shift for each function. Then graph the function. 𝜋 a) 𝑦 = −3 + 2𝑆𝑖𝑛2(𝜃 + 4 ) Amplitude: 2, Period: 360 2 =180 Phase shift: 𝜋 4 𝑡𝑜 𝑙𝑒𝑓𝑡 Vertical shift: 3 units to down Draw dashed lines for the midline 𝑦 = −3 , and for the amplitude b) 𝑦 = 4 + 3𝐶𝑜𝑠2𝑥 0 ≤ 𝑥 ≤ 2𝜋 360 Amplitude:3, Period: Phase shift:NO Vertical shift: 4 units up 2 =180 Draw dashed lines for the midline 𝑦 = 4 , and for the amplitude You need to draw two cycles in this case ATHS-ALAin, FC/Math Grade 11 Regular Page 2 𝜋 Q3) WEATHER The function 𝑦 = 60 + 25𝑆𝑖𝑛 6 𝑡,where t is in months and t=0 corresponds to April 15, models the average high temperature in degrees Fahrenheit in Centerville. a. Determine the period of this function. What does this period represent? 2𝜋 Period: 𝜋/6 =12, every 12 months the weather will repeat itself. b. What is the maximum high temperature and when does this occur? 85 Fahrenheit, July 15 Q4) Write a trigonometric function that has amplitude of 5 and period of 720. Then graph the function. 1 1 𝑦 = 5𝑠𝑖𝑛 2 𝜃 or 𝑦 = 5𝑐𝑜𝑠 2 𝜃 Q5) Match the function with its graph. 1-F 2-B 3-E 4- A 5-C 6-D ATHS-ALAin, FC/Math Grade 11 Regular Page 3
