Electrophoresis of Amino Acids
advertisement
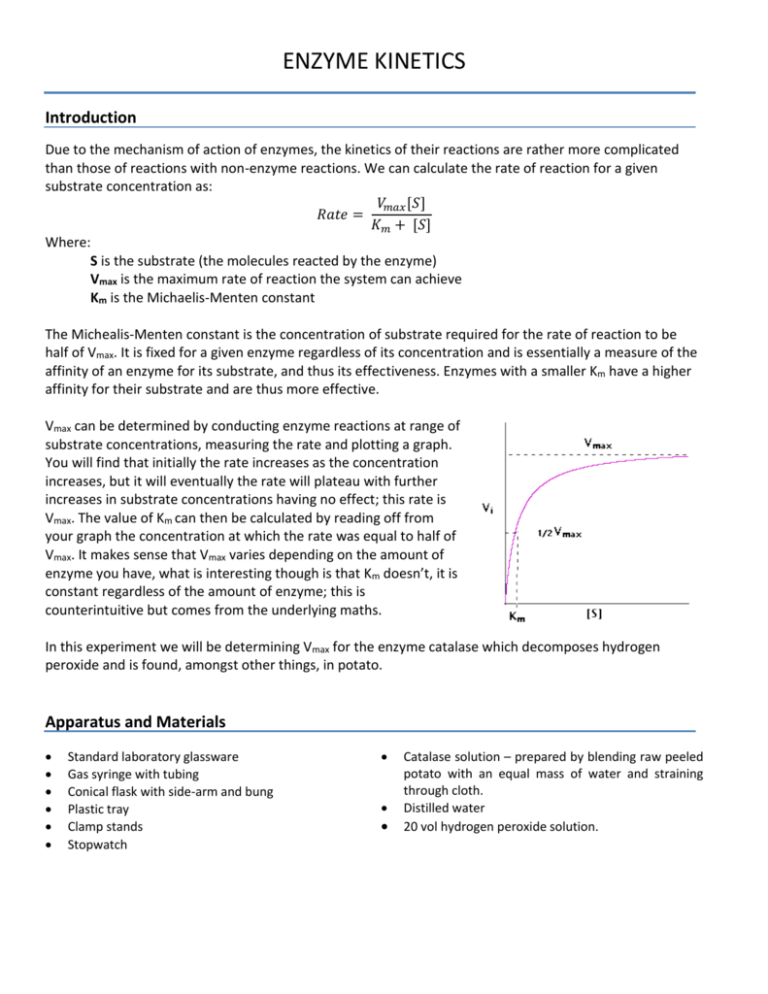
ENZYME KINETICS Introduction Due to the mechanism of action of enzymes, the kinetics of their reactions are rather more complicated than those of reactions with non-enzyme reactions. We can calculate the rate of reaction for a given substrate concentration as: 𝑉𝑚𝑎𝑥 [𝑆] 𝑅𝑎𝑡𝑒 = 𝐾𝑚 + [𝑆] Where: S is the substrate (the molecules reacted by the enzyme) Vmax is the maximum rate of reaction the system can achieve Km is the Michaelis-Menten constant The Michealis-Menten constant is the concentration of substrate required for the rate of reaction to be half of Vmax. It is fixed for a given enzyme regardless of its concentration and is essentially a measure of the affinity of an enzyme for its substrate, and thus its effectiveness. Enzymes with a smaller Km have a higher affinity for their substrate and are thus more effective. Vmax can be determined by conducting enzyme reactions at range of substrate concentrations, measuring the rate and plotting a graph. You will find that initially the rate increases as the concentration increases, but it will eventually the rate will plateau with further increases in substrate concentrations having no effect; this rate is Vmax. The value of Km can then be calculated by reading off from your graph the concentration at which the rate was equal to half of Vmax. It makes sense that Vmax varies depending on the amount of enzyme you have, what is interesting though is that Km doesn’t, it is constant regardless of the amount of enzyme; this is counterintuitive but comes from the underlying maths. In this experiment we will be determining Vmax for the enzyme catalase which decomposes hydrogen peroxide and is found, amongst other things, in potato. Apparatus and Materials Standard laboratory glassware Gas syringe with tubing Conical flask with side-arm and bung Plastic tray Clamp stands Stopwatch Catalase solution – prepared by blending raw peeled potato with an equal mass of water and straining through cloth. Distilled water 20 vol hydrogen peroxide solution. Procedure 1. 2. 3. 4. 5. 6. 7. Pour out about 50 cm3 of 20 vol hydrogen peroxide and allow to reach room temperature (it will be cold from the fridge). Secure the gas syringe to a clamp-stand; connect the side-arm flask via the tubing. Place a plastic tray beneath the gas syringe to catch the end without breaking it in case it pops out. In three separate measuring cylinders measure out catalase solution, distilled water and 20 vol hydrogen peroxide solution in the amounts shown in the table below. Add the hydrogen peroxide and the water to the side-arm flask and swirl to mix. Simultaneously add the catalase solution, secure the bung in place, swirl to mix and start the stopwatch (two pairs of hands useful!). Swirl continuously and record how long it takes to collect 10 cm3 of gas. Repeat with the remaining reaction mixtures. Do not do them in order, do the first, then the last, then the middle and so on so that if you run out of time you will still have a broad range of results. Run Volume of catalase solution (cm3) 1 2 3 4 5 6 7 8 9 10 2.0 2.0 2.0 2.0 2.0 2.0 2.0 2.0 2.0 2.0 Volume of 20 vol hydrogen peroxide solution (cm3) 10.0 9.0 8.0 7.0 6.0 5.0 4.0 3.0 2.0 1.0 Volume of distilled water (cm3) 0.0 1.0 2.0 3.0 4.0 5.0 6.0 7.0 8.0 9.0 Analysis You should do these calculations with a spreadsheet: a. Calculate the number of moles of oxygen in 10 cm3. b. Use the answer to a to calculate the decrease in H2O2 concentration that must have occurred in order to collect 10 cm3 of gas. Hint: you do not need to know the initial concentration of H2O2 in order to work this out. c. Calculate the rate for each variation of the experiment. d. Calculate the concentration of 20 vol H2O2. Hint: ‘20 vol’ means it produces 20 times its own volume in gas as it decomposes. e. Use the answer to d to calculate the initial concentration of H2O2 for each run of the experiment. f. Produce a graph with the initial concentrations on the x-axis and the rate of reaction on the y-axis. g. Add a suitable trend line to the graph and use this to identify Vmax (you may need to extrapolate the graph). h. Use your graph to determine Km and compare this value to one found online. i. Use your understanding of the mechanism of enzyme catalysis to suggest why Vmax happens.
