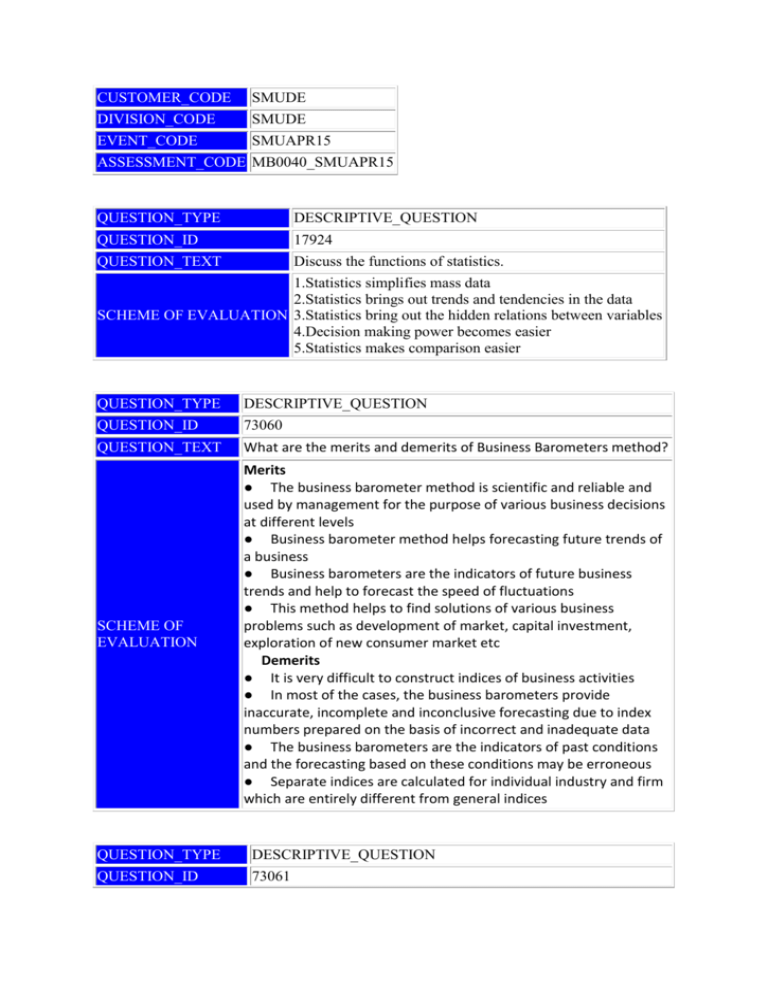
CUSTOMER_CODE SMUDE DIVISION_CODE SMUDE
advertisement

CUSTOMER_CODE SMUDE DIVISION_CODE SMUDE EVENT_CODE SMUAPR15 ASSESSMENT_CODE MB0040_SMUAPR15 QUESTION_TYPE DESCRIPTIVE_QUESTION QUESTION_ID 17924 QUESTION_TEXT Discuss the functions of statistics. 1.Statistics simplifies mass data 2.Statistics brings out trends and tendencies in the data SCHEME OF EVALUATION 3.Statistics bring out the hidden relations between variables 4.Decision making power becomes easier 5.Statistics makes comparison easier QUESTION_TYPE DESCRIPTIVE_QUESTION QUESTION_ID 73060 QUESTION_TEXT What are the merits and demerits of Business Barometers method? SCHEME OF EVALUATION Merits ● The business barometer method is scientific and reliable and used by management for the purpose of various business decisions at different levels ● Business barometer method helps forecasting future trends of a business ● Business barometers are the indicators of future business trends and help to forecast the speed of fluctuations ● This method helps to find solutions of various business problems such as development of market, capital investment, exploration of new consumer market etc Demerits ● It is very difficult to construct indices of business activities ● In most of the cases, the business barometers provide inaccurate, incomplete and inconclusive forecasting due to index numbers prepared on the basis of incorrect and inadequate data ● The business barometers are the indicators of past conditions and the forecasting based on these conditions may be erroneous ● Separate indices are calculated for individual industry and firm which are entirely different from general indices QUESTION_TYPE DESCRIPTIVE_QUESTION QUESTION_ID 73061 QUESTION_TEXT a. b. Write 5 importance of diagram and 5 limitations of diagrams? Write 5 general rules for drawing the diagram? SCHEME OF EVALUATION Importance of diagram: 1. They are simple, attractive and easily understandable 2. They give quick information 3. It helps to compare the variables 4. Diagrams are more suitable to illustrate discrete data 5. It will have more stable effect in the readers mind Limitations of diagram 1. Diagram shows approximate value 2. Diagrams are not suitable for further analysis 3. Some diagrams are limited to experts (multidimensional) 4. Details cannot be provided fully 5. It is useful only for comparison (5 marks) General rules for drawing the diagram: 1. Each diagram should have a suitable title indicating the theme with which the diagram is intended, at the top or at the bottom. 2. The size of the diagram should emphasize the important characteristics of the data. 3. Approximate proposition should be maintained for length and breadth of the diagram 4. A proper/suitable scale to be adopted for diagram 5. Selection of approximate diagram is important and wrong selection may mislead the reader. (5 marks) QUESTION_TYPE DESCRIPTIVE_QUESTION QUESTION_ID 73063 QUESTION_TEXT What are the components of time series? Explain SCHEME OF EVALUATION Long term trend or secular trend: This refers to the smooth or regular long term growth or decline of the series. This movement can be characterized by a trend curve. If this curve is a straight line, then it is called a trend line. If the variable increases over a long period of time, then it is called an upward trend. If the variable decreases over a long period of time, then it is called downward trend. If the variable moves upward or downward along a straight line then the trend is called a linear trend, otherwise it is called a non-linear trend (2.5 marks) Seasonal variations: Variations in a time series that are periodic in nature and occur regularly over short periods of time during a year are called seasonal variations. These variations are precise and can be forecasted The following is the example of seasonal variations in a time series The prices of vegetables drop down after rainy season or in winter months and they go up during summer, every year (2.5 marks) Cyclic variations:The long-term oscillations that represent consistent rise and decline in the values of the variables are called cyclic variations. Since these are long-term oscillations in the time series, the period of oscillation is usually greater than one year. The oscillations are either a trend curve or a trend line. The period of one cycle is the time-distance between two successive peaks or two successive troughs (2.5 marks) Random variations: Random variations are called irregular movements. Movements that occur usually in brief periods of time, without any pattern and which are unpredictable in nature are called irregular movements. These movements do not have any regular period or time of occurrences. For example, the effect of national strikes, floods, earthquakes, etc. It is very difficult to study the behavior of such a time series (2.5 marks) QUESTION_TYPE DESCRIPTIVE_QUESTION QUESTION_ID 125194 QUESTION_TEXT Explain the objectives of statistical average and also list the requisites of a good average. SCHEME OF EVALUATION The statistical average or simply an average refers to the measure of middle value of the data set. The objectives of statistical average are to: · Present mass data in a concise form – The mass data is condensed to make the data readable and to use it for further analysis. It is very difficult for human mind to grasp a large body of numerical figures. A measure of average is used to summarize such data into a single figure which makes it easier to understand, · Facilitate comparison – It is difficult to compare two different sets mass data. However, we can compare those two after computing the averages of individual data sets. While comparing, the same measures average should be used. It leads to incorrect conclusions when mean salary of employees is compared with the median salary of employees. · Establish relationship between data sets – The average can be used to draw inferences about the unknown relationships between the data sets. Computing the averages of the data sets is helpful for estimating the average of population. · Provide basis for decision–making – In many fields such as business, finance, insurance and other sectors, managers compute the averages and draw useful inferences or conclusions for taking effective decisions. (5 marks) Requisites of a Good Average Following are the requisites of a good average: · It should be simple to calculate and easy to understand · It should be based on all values · It should not be affected by extreme values · It should not be affected by sampling fluctuation · It should be rigidly defined, preferably by an algebraic formula, so different persons obtain the same value for a given set of data By following these requisites, we can achieve a good average (5 marks) QUESTION_TYPE DESCRIPTIVE_QUESTION QUESTION_ID 125200 Write a note on i. Business Forecasting QUESTION_TEXT ii. i. Time series Analysis Business Forecasting– Business forecasting refers to the analysis of past and present economic conditions with the object of drawing inferences about probable future business conditions. The process of making definite estimates of future course of events is referred to as forecasting and the figure or statements obtained from the process is known as ‘forecast’, future course of events is rarely known. In order to be assured of the coming course of events, an organized system of forecasting helps. The following are two aspects of scientific business forecasting. SCHEME OF EVALUATION 1. Analysis of Past economic conditions 2. Analysis of Present economic conditions– ii. Time series Analysis In a time series, we need to study about the forces that influence the variations in time series and the behavior of phenomenon over the given period of time. For example consider the sales of T.V sets (in thousands) by a producing company. There can be changes in the values of the variable recorder over different points of time due to various forces. Analyzing the effect of all such forces on the values of the variable is generally known as the Analysis Time series. Following are the 4 types of changes in the values of the variable– 1. Changes which generally occur due to general tendency of the data to increase or decrease 2. Changes which generally due to change in climate, weather conditions and festivals 3. Changes which occur due to booms and depressions 4. Changes which occur due to unpredictable forces like floods, famines and earth quakes


