Homework 3 (21 points) Name(s) _____SOLUTION______ STAT
advertisement
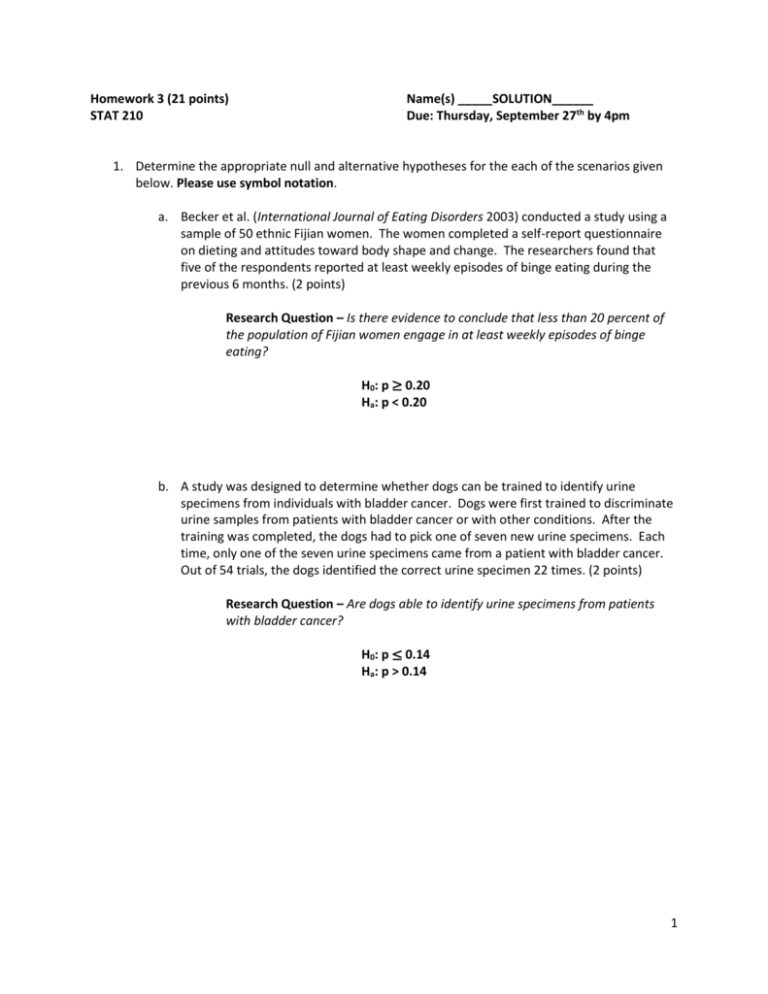
Homework 3 (21 points) STAT 210 Name(s) _____SOLUTION______ Due: Thursday, September 27th by 4pm 1. Determine the appropriate null and alternative hypotheses for the each of the scenarios given below. Please use symbol notation. a. Becker et al. (International Journal of Eating Disorders 2003) conducted a study using a sample of 50 ethnic Fijian women. The women completed a self-report questionnaire on dieting and attitudes toward body shape and change. The researchers found that five of the respondents reported at least weekly episodes of binge eating during the previous 6 months. (2 points) Research Question – Is there evidence to conclude that less than 20 percent of the population of Fijian women engage in at least weekly episodes of binge eating? H0: p ≥ 0.20 Ha: p < 0.20 b. A study was designed to determine whether dogs can be trained to identify urine specimens from individuals with bladder cancer. Dogs were first trained to discriminate urine samples from patients with bladder cancer or with other conditions. After the training was completed, the dogs had to pick one of seven new urine specimens. Each time, only one of the seven urine specimens came from a patient with bladder cancer. Out of 54 trials, the dogs identified the correct urine specimen 22 times. (2 points) Research Question – Are dogs able to identify urine specimens from patients with bladder cancer? H0: p ≤ 0.14 Ha: p > 0.14 1 2. Wild-type fruit flies have red eyes, but a recessive mutation produces white-eyed individuals. A researcher wants to assess the frequency of heterozygous individuals from among red-eyed fruit flies. A heterozygous red-eyed fly crossed with a white-eyed mutant will have a mixed progeny. Of the 100 red-eyed fruit flies crossed with white-eyed mutants, 11 produced a mixed progeny. a. Construct a 95% confidence interval by hand for the proportion of mixed progeny. (3 points) n = 100 pˆ = 11 = 0.11 100 z = 1.96 2(100)(0.11) + 1.962 1.96 1.962 + 4(100)(0.11)(0.89) ± 2 100 + 1.962 2 100 + 1.962 25.84 12.85 ± 0.12 ± 0.06 0.06 ≤ p ≤ 0.18 207.68 207.68 b. Interpret the 95% confidence interval constructed in part a. (3 points) 95% confident the true proportion of red-eyed fruit flies crossed with whiteeyed mutants with mixed progeny is between 0.06 and 0.18. c. Using JMP, verify the 95% confidence interval you constructed in part a. Make sure to provide your JMP output or a detailed sketch of the output below. (2 points) 2 3. Genetic counselors work with pregnant women (usually women at high risk of fetal abnormalities or those who might not be at high risk but screen positive for abnormalities based on standard screening tests) and hypothesize that about one-half of all abnormalities are trisomy 21, one-third trisomy 18, and the remainder are trisomy 13. (Trisomy indicates three copies of a particular chromosome, e.g. 21, and reflects a particular abnormality associated with that chromosome.) A random sample of 200 pregnant women who deliver babies with abnormalities were studied and the results are summarized below. Abnormality Trisomy 21 Trisomy 18 Trisomy 13 Total Observed Frequency 107 70 23 200 Research Question – Does the pattern of abnormalities observed fit the pattern hypothesized by genetic counselors? a. Set up the null and alternative hypotheses for this scenario. (2 points) H0: ptrisomy 21 = 0.50 ptrisomy 18 = 0.33 ptrisomy 13 = 0.17 Ha: Two or more differ b. Find the expected counts which would be used in the computation of the Chi-square test statistic. Make sure to show how you computed the expected counts. (2 points) Abnormality Trisomy 21 Trisomy 18 Trisomy 13 Total Expected Count 200(0.50) = 100 200(0.33) = 66 200(0.17) = 34 200 c. Using JMP, find the test statistic and p-value for this test. Paste or provide a detailed sketch of the appropriate JMP below. (2 points) Test Statistic = 4.2912 p-value = 0.1170 d. Based on the p-value found in part c, does this study provide evidence the observed pattern of abnormalities fits the pattern hypothesized by genetic counselors? Explain. (3 points) Evidence (p-value = 0.0001) that the observed pattern of abnormalities does not fit the pattern hypothesized by genetic counselors. 3
