Stat1342 Quiz 8 Solution 1-5. Do educational toys make a difference
advertisement
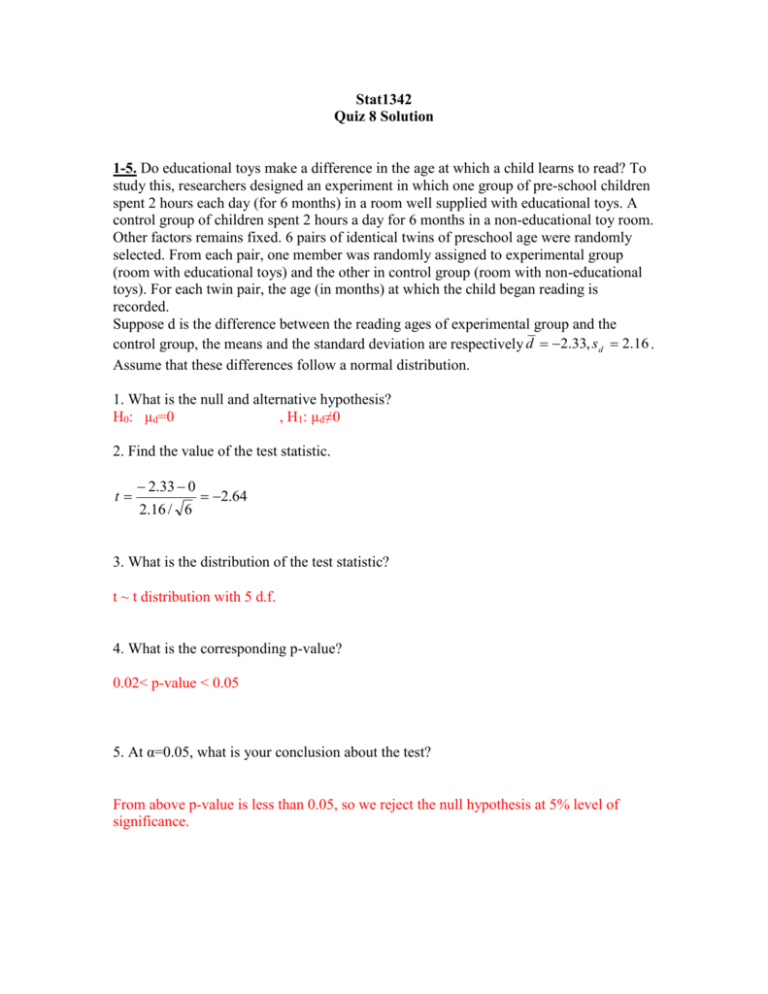
Stat1342 Quiz 8 Solution 1-5. Do educational toys make a difference in the age at which a child learns to read? To study this, researchers designed an experiment in which one group of pre-school children spent 2 hours each day (for 6 months) in a room well supplied with educational toys. A control group of children spent 2 hours a day for 6 months in a non-educational toy room. Other factors remains fixed. 6 pairs of identical twins of preschool age were randomly selected. From each pair, one member was randomly assigned to experimental group (room with educational toys) and the other in control group (room with non-educational toys). For each twin pair, the age (in months) at which the child began reading is recorded. Suppose d is the difference between the reading ages of experimental group and the control group, the means and the standard deviation are respectively d 2.33, s d 2.16 . Assume that these differences follow a normal distribution. 1. What is the null and alternative hypothesis? H0: µd=0 , H1: µd≠0 2. Find the value of the test statistic. t 2.33 0 2.16 / 6 2.64 3. What is the distribution of the test statistic? t ~ t distribution with 5 d.f. 4. What is the corresponding p-value? 0.02< p-value < 0.05 5. At α=0.05, what is your conclusion about the test? From above p-value is less than 0.05, so we reject the null hypothesis at 5% level of significance. 6. Arsenic occurs naturally in ground water. A mean arsenic level of μ=8.0 ppb is considered safe for agricultural use. A well in Texas is used to water cotton crops. This well is tested on a regular basis for arsenic. A random sample of 37 tests gave a sample mean of 7.2 ppb of arsenic. Suppose from the past it is known that the population standard deviation is 1.9 ppb. Does this information indicate that the mean level of arsenic in this well is less than 8 ppb? Based on this answer the following Which of the following tests is applicable? (i) Z-test (ii) t-Test. (iii) paired t-test. 7. Do SAT coaching classes work? Do they help students to improve their test scores? Four students were selected randomly from all of the students that completed an SAT coaching class. For each student, we recorded their first SAT score (before the class) and their second SAT score (after the coaching class). First SAT score Second SAT score Student 1 2 3 4 920 830 1010 800 960 910 1000 980 To analyze this data, we should use (i) the one-sample t test. (ii) t test for paired data. (iii) the two-sample t test. (iv) Any of the above are valid. It just needs to be a t since σ is unknown.

