jfb12672-sup-0001-AppendixS1
advertisement
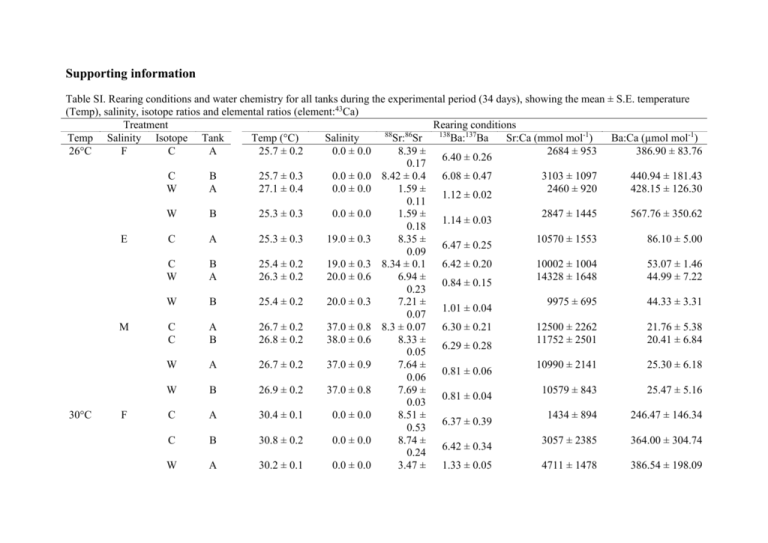
Supporting information Table SI. Rearing conditions and water chemistry for all tanks during the experimental period (34 days), showing the mean ± S.E. temperature (Temp), salinity, isotope ratios and elemental ratios (element:43Ca) Treatment Rearing conditions 88 138 Temp Salinity Isotope Tank Temp (°C) Salinity Sr:86Sr Ba:137Ba Sr:Ca (mmol mol-1) Ba:Ca (µmol mol-1) 26°C F C A 25.7 ± 0.2 0.0 ± 0.0 8.39 ± 2684 ± 953 386.90 ± 83.76 6.40 ± 0.26 0.17 C B 25.7 ± 0.3 0.0 ± 0.0 8.42 ± 0.4 6.08 ± 0.47 3103 ± 1097 440.94 ± 181.43 W A 27.1 ± 0.4 0.0 ± 0.0 1.59 ± 2460 ± 920 428.15 ± 126.30 1.12 ± 0.02 0.11 W B 25.3 ± 0.3 0.0 ± 0.0 1.59 ± 2847 ± 1445 567.76 ± 350.62 1.14 ± 0.03 0.18 E C A 25.3 ± 0.3 19.0 ± 0.3 8.35 ± 10570 ± 1553 86.10 ± 5.00 6.47 ± 0.25 0.09 C B 25.4 ± 0.2 19.0 ± 0.3 8.34 ± 0.1 6.42 ± 0.20 10002 ± 1004 53.07 ± 1.46 W A 26.3 ± 0.2 20.0 ± 0.6 6.94 ± 14328 ± 1648 44.99 ± 7.22 0.84 ± 0.15 0.23 W B 25.4 ± 0.2 20.0 ± 0.3 7.21 ± 9975 ± 695 44.33 ± 3.31 1.01 ± 0.04 0.07 M C A 26.7 ± 0.2 37.0 ± 0.8 8.3 ± 0.07 6.30 ± 0.21 12500 ± 2262 21.76 ± 5.38 C B 26.8 ± 0.2 38.0 ± 0.6 8.33 ± 11752 ± 2501 20.41 ± 6.84 6.29 ± 0.28 0.05 W A 26.7 ± 0.2 37.0 ± 0.9 7.64 ± 10990 ± 2141 25.30 ± 6.18 0.81 ± 0.06 0.06 W B 26.9 ± 0.2 37.0 ± 0.8 7.69 ± 10579 ± 843 25.47 ± 5.16 0.81 ± 0.04 0.03 30°C F C A 30.4 ± 0.1 0.0 ± 0.0 8.51 ± 1434 ± 894 246.47 ± 146.34 6.37 ± 0.39 0.53 C B 30.8 ± 0.2 0.0 ± 0.0 8.74 ± 3057 ± 2385 364.00 ± 304.74 6.42 ± 0.34 0.24 W A 30.2 ± 0.1 0.0 ± 0.0 3.47 ± 1.33 ± 0.05 4711 ± 1478 386.54 ± 198.09 1.49 W B 31.1 ± 0.2 0.0 ± 0.0 1.71 ± 2303 ± 1067 424.88 ± 236.52 1.21 ± 0.03 0.16 E C A 30.6 ± 0.1 19.0 ± 0.3 8.28 ± 10336 ± 810 43.30 ± 2.75 6.39 ± 0.22 0.11 C B 30.7 ± 0.2 20.0 ± 0.4 8.34 ± 11345 ± 2645 46.09 ± 14.40 6.54 ± 0.17 0.03 W A 30.6 ± 0.1 20.0 ± 0.2 7.34 ± 8121 ± 929 44.73 ± 10.18 1.04 ± 0.07 0.12 W B 30.7 ± 0.2 19.0 ± 0.2 7.21 ± 9074 ± 2366 46.22 ± 14.05 0.95 ± 0.02 0.01 M C A 30.4 ± 0.2 40.0 ± 0.5 8.26 ± 10385 ± 1387 18.01 ± 3.77 6.51 ± 0.12 0.11 C B 30.6 ± 0.1 38.0 ± 0.8 8.35 ± 9882 ± 885 18.14 ± 4.92 6.39 ± 0.24 0.03 W A 30.2 ± 0.2 40.0 ± 0.6 7.74 ± 11357 ± 4085 26.32 ± 10.93 0.89 ± 0.03 0.07 W B 30.4 ± 0.1 38 .0± 0.9 7.71 ± 8667 ± 1816 21.77 ± 7.01 0.86 ± 0.05 0.03 F, fresh water (salinity 0); E, estuarine (salinity 20); M, marine (salinity 40); C, control treatment; W, water enriched with 137Ba and 86Sr. Table SII. Analysis of variance of rearing conditions (recorded temperature and salinity) among treatment tanks. Temperature (T) Salinity (S) TS Tank (T S) Residual d.f. 1 2 2 6 448 Temperature MS F 2266.60 481.09 8.01 1.70 21.45 4.55 4.71 5.88 0.80 P ≤ 0.001 > 0.05 > 0.05 ≤ 0.001 d.f. 1 2 2 6 352 Salinity MS F 25.77 2.25 44411.00 3873.00 12.65 1.10 11.47 3.20 3.59 P > 0.05 ≤ 0.001 > 0.05 < 0.05 DIET ISOTOPE ANALYSES Experimental fish were fed on a marine-based 1.5 mm floating pellet diet (Lucky Star) throughout the pre- and experimental periods. Triplicate diet samples were oven dried, ground to a powder, dissolved in ultrapure HNO3 , diluted 50:1, and passed through a 0.45 µm filter (Woodcock et al., 2012). Samples were then analysed for Sr, Ba and Ca isotopes following the same protocol as the water samples (refer to Materials and Methods). The mean (± standard errors) element ratio were 88Sr:43Ca = 19.69 ± 0.73 mmol mol-1 and 138Ba:43Ca = 0.11 ± 0.001 mmol mol-1. Dietary isotope values were 88Sr/86Sr = 9.05 ± 0.06 and 138Ba/137Ba = 6.37 ± 0.01; however, these values were not used in the final calculations of percent contribution values, as the isotopic values measured in the diet were considerably higher than natural ratios (particularly for strontium). Table SIII. Summary of literature assessing the per cent contribution of water to otolith Sr and Ba chemistry based on isotopic variations. Adapted from Doubleday et al. (2013) Species Family Environmental Salinity niche Bidyanus bidyanus Terapontidae Obligate freshwater 0 Lates calcarifer Latridae Catadromous 0 Maccullochella peelii Percichthyidae Obligate freshwater 0 Macquaria ambigua Percichthyidae Obligate freshwater 0 Oreochromis niloticus Cichlidae Obligate freshwater 0 Oncorhynchus mykiss Salmonidae Anadromous 0 Salmo salar Salmonidae Anadromous 0 Acanthopagrus butcheri Sparidae Obligate estuarine 10 Acanthopagrus butcheri Sparidae Obligate estuarine 20 Lates calcarifer Latridae Catadromous 20 Acanthopagrus butcheri Sparidae Obligate estuarine 30 Fundulus heteroclitus Fundulidae Opportunistic estuarine 30 Lates calcarifer Latridae Catadromous 40 a ranges associated with different temperatures and within salinity treatments. Isotope type enriched enriched enriched enriched radionatural natural enriched enriched enriched enriched enriched enriched %Sr %Ba 71 77-93 64 64 88 66 30 67-78 76-81 65-99 62-83 83 82-84 92 82-89 89 87 73-82 69-76 64-75 70-78 98 64-76 Source Doubleday et al. (2013) this study a Doubleday et al. (2013) Doubleday et al. (2013) Farrell and Campana (1996) Gibson-Reinemer et al. (2009) Kennedy et al. (2000) Webb et al. (2012) a Webb et al. (2012) a this study a Webb et al. (2012) a Walther and Thorrold (2006) this study a Supporting Information References Farrell, J.& Campana, S.E. (1996). Regulation of calcium and strontium deposition on the otoliths of juvenile tilapia, Oreochromis niloticus. Comparative Biochemistry and Physiology A 115, 103-109. Gibson-Reinemer, D.K., Johnson, B.M., Martinez, P.J., Winkelman, D.L., Koenig, A.E.& Woodhead, J.D. (2009). Elemental signatures in otoliths of hatchery rainbow trout (Oncorhynchus mykiss): distinctiveness and utility for detecting origins and movement. Canadian Journal of Fisheries and Aquatic Sciences 66, 513-524. Walther, B.D. & Thorrold, S.R.( 2006). Water, not food, contributes the majority of strontium and barium deposited in the otoliths of a marine fish. Marine Ecology Progress Series 311, 125-130.


