Environmental risks in resource-poor settings: the case of salination
advertisement
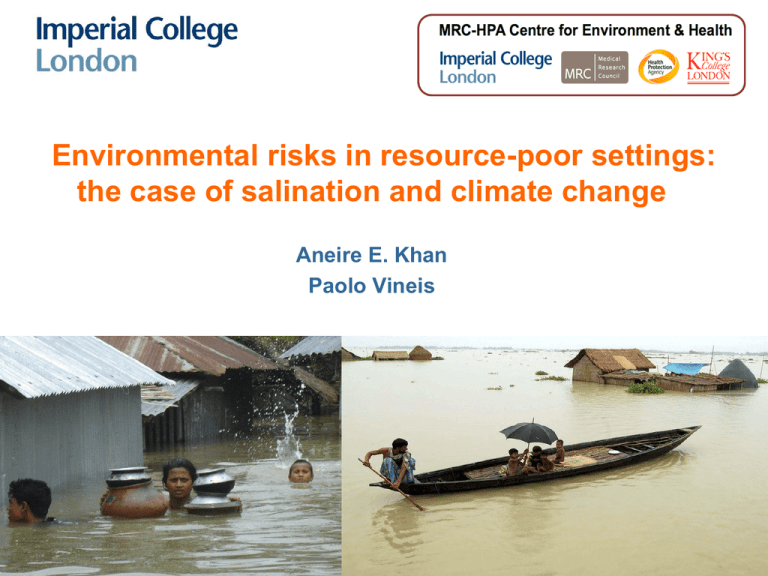
Environmental risks in resource-poor settings: the case of salination and climate change Aneire E. Khan Paolo Vineis A neglected consequence of climate change is the increasing salinity level in coastal areas, due to several mechanisms including sea level rise. Salinity in drinking water can reach extremely high levels like in coastal Bangladesh, and potentially millions of people are exposed to a substantial risk of high blood pressure. The setting and the problem • Bangladesh is vulnerable to natural hazards and the future effects of climate change. – Deltaic plains of the Ganges, Brahmaputra Meghna rivers – Suffer from acute climate events – floods, droughts, cyclones – Long-term environmental degradation → salination & soil degradation, river erosion – Effects likely to be exacerbated by climate change & sea-level rise Simplified causal diagram of salinity & health Shrimp farming Poor land management Runoff Rainfall, Monsoon River flow Snowmelt Sea-level rise CLIMATE CHANGE Estuarine intrusion Saltwater intrusion [shallow groundwater] Surface water salinity [downstream] [river] Pond water [consumption] Health effects Prevalence of hypertensive disorders in women attending antenatal check-ups in Dacope and other areas [May – July 2007] (Khan et al., Lancet 2008) 16 14 12 10 preeclampsia eclampsia hypertension 8 6 4 2 0 Dacope Terokhada Matwail Prevalence rates of hypertension (with or without proteinuria) among pregnant patients aged 13-45, recorded between July 2008 and March 2010 in Upazilla Health Complex, Dacope, Bangladesh. Month No. of cases Total no. of pregnancies Prevalence (95 % C.I.) May – Sept Oct - April 20 70 393 576 5.09 (2.91 – 7.26) 12.2 (9.48 – 14.8) Total 90 969 9.28 (7.46 – 11.1) Prevalence odds ratio (95% CI): 2.39 (1.43 – 3.99) Khan et al, Environmental Health Perspectives, 2011 Geographic distribution of sodium levels in water Average sodium levels in drinking water in the different areas included in the study (1,006 healthy pregnant women at week 20 of pregnancy)(Khan et al, submitted) Mean Water Sodium by water source 24-hr urinary sodium (mmol/d) by water source Testing the hypothesis: case-control study Logistic regression of disease outcome (pre-eclampsia, eclampsia and/or gestational hypertension) with water sodium levels Water sodium mg/L Cases (n=202) Controls (n=1006) Min – 300 43 (21.3) 1.00 2.73 (1.70 – 4.40) 3.36 (2.07 – 5.60) 3.65 (2.30 – 5.80) 4.35 (2.61 – 6.94) 5.21 (3.25 – 8.33) 5.40 (3.28 – 8.92) 97 (17.5) 900.01 - max 59 (29.2) 1.00 106 (19.2) 600.01 – 900 55 (27.2) OR Adjusted by age, parity, SES 277 (50.1) 300.01 – 600 45 (22.3) Crude Odds Ratio (OR) 73 (13.2) A large share of the population in coastal Bangladesh may be consuming levels of up to 16g/day of salt in the dry season from only 2L of natural drinking water. Based on the INTERSALT model, the changes introduced by water salinity would lead a large proportion of the population to develop pre-hypertension (systolic BP between 120 and 139mmHg or diastolic BP between 80 and 89mmHg) and hypertension (SBP>140mmHg or DBP>90mmHg), depending on the baseline levels. The larger picture 634 million people live in coastal areas within 30 feet (9.1m) of sea level. About two-thirds of the World’s cities with over 5 million people are located in these low-lying coastal areas. The IPCC predicts that sea level will further increase in the next decades. This will make the problem of salinity in drinking water becoming a major health issue in most coastal areas, particularly in low-income countries. Relative vulnerability of coastal deltas by number of people potentially displaced by trends to year 2050. (Extreme= >1 million; High= 1 million to 50,000; Medium=50,000 to 5000. (Ericson et al 2006) Perspectives For better description and prediction - including in other areas of the world - remote sensing can be used Satellite images capture the density of “yellow matter” (CDOM) in estuaries and ponds. Yellow matter is an indirect and reliable estimate of salinity (in collaboration with D Bowers, Bangor University) A satellite image of Bangladesh. Much of the country is a vast river delta for the Ganges, Brahmaputra and Meghna Rivers. Directly in the middle of the image, just at the edge of the world’s largest mangrove forests – the Sundarbans (dark green ), shrimp farming has taken over from rice farming. Photo from http://www.spiegel.de/fotostrecke/fotostrecke-21321-2.html Relationship between surface salinity and CDOM in the Clyde Sea. (Binding et al 2003) Relationships between surface salinity and yellow substance (g440) for each of the three Clyde Sea surveys at different time points. (Binding et al 2003) Summary of studies that have used satellite images for salinity modelling in estuarine areas, using CDOM as a proxy Sensor Spatial resolution R2 Value Difference Between Observed and Predicted Salinity (ppt) Observed Salinity Range (ppt) Reference Sofala Bank, Mozambi que SeaWifs 1.1km 0.76 ±1.5 24-35 Siddorn et al 2001 (122) Clyde Sea, Scotland SeaWifs 1.1km 0.93 +1.1 16-34 Binding et al 2003 East China Sea SeaWifs 1.1km 0.86 ±1.0 26-34 Y.H.Ahn et al 2008 (123) Columbia River Plume, USA MODIS 250m 0.92 Single value unavailable as authors used 2 different models at 2 different dates*** 0-30 Palacios et al 2009 (124) Mandovi* and Zuari Estuary Ocean Colour Monitor 360m 0.76 Correlation, R2=0.75 31-34 Menon et al 2010 (125) Location Estimates of the overall impact on a world scale – in estuarine areas - can be made after validation of satellite data. We are now conducting a study in Bangladesh that combines hydrology (Adrian Butler, Mohammad Hoque, Imperial College), sodium measurements in 500 women (Aneire Khan, ICL) and satellite data (Pauline Scheelbeek, Yu-Jeat Chong, ICL; David Bowers, Bangor University) Funded by the Grantham Institute, Imperial College, and Leverhulme Trust (grant to PV, 2011) Thank you!
