Quantitative Genetics Key
advertisement
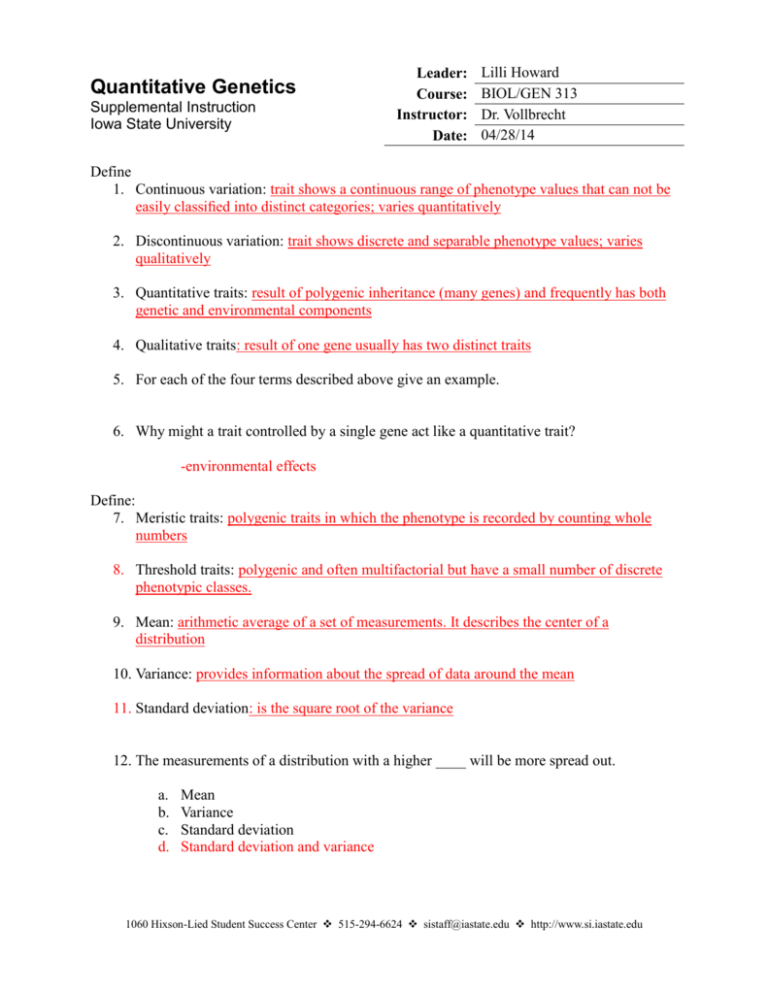
Quantitative Genetics Supplemental Instruction Iowa State University Leader: Course: Instructor: Date: Lilli Howard BIOL/GEN 313 Dr. Vollbrecht 04/28/14 Define 1. Continuous variation: trait shows a continuous range of phenotype values that can not be easily classified into distinct categories; varies quantitatively 2. Discontinuous variation: trait shows discrete and separable phenotype values; varies qualitatively 3. Quantitative traits: result of polygenic inheritance (many genes) and frequently has both genetic and environmental components 4. Qualitative traits: result of one gene usually has two distinct traits 5. For each of the four terms described above give an example. 6. Why might a trait controlled by a single gene act like a quantitative trait? -environmental effects Define: 7. Meristic traits: polygenic traits in which the phenotype is recorded by counting whole numbers 8. Threshold traits: polygenic and often multifactorial but have a small number of discrete phenotypic classes. 9. Mean: arithmetic average of a set of measurements. It describes the center of a distribution 10. Variance: provides information about the spread of data around the mean 11. Standard deviation: is the square root of the variance 12. The measurements of a distribution with a higher ____ will be more spread out. a. b. c. d. Mean Variance Standard deviation Standard deviation and variance 1060 Hixson-Lied Student Success Center 515-294-6624 sistaff@iastate.edu http://www.si.iastate.edu 13. A geneticist is interested in whether asthma is caused by a mutation in the DS112 gene. The geneticist collects DNA from 120 people with asthma and 100 healthy people and sequences the DNA. She finds that 35 people with asthma and non of the healthy people have a mutation in the DS112 gene. What is the population in this study? a. The 120 people with asthma b. The 100 healthy people c. The 35 people with a mutation in their gene d. All people with asthma 14. Explain the relationship between a population and a sample. What characteristics should a sample have to be representative of the population? -a sample is a subset of a population. To be representative of the population, the sample should be randomly selected and sufficiently large to minimize random differences between members of the sample and the population. 15. List all the components that contribute to the phenotypic variance and define each component. Vg: component of variance due to variation in genotype Va: due to additive genetic variance Vd: due to dominance genetic variance Vi: due to genic interaction variance Ve: due to environmental differences Vge: due to the intereaction of genes and environment 16. For each of the following characteristics, indicate whether it would be considered a discontinuous or a quantitative characteristic. Justify your answer. a. Kernel color in a strain of wheat in which two co-dominant alleles segregating at a single locus determine the color. Thus, there are three phenotypes present in this strain: White, light red, and medium red. Discontinuous, because only a few distinct phenotypes are present and its determined by alleles at a single locus. b. Body weight in a family of Labrador retrievers. An autosomal recessive allele that causes dwarfism is present in this family. Two phenotypes are recognized: dwarf and normal. Discontinuous because there are only two phenotypes and a single locus c. Presence or absences of leprosy. Susceptibility to leprosy is determined by multiple genes and numerous environmental factors. Quantitative because susceptibility is a continuous trait determined by multiple genes and environmental factors d. Number of toes in guinea pigs, which is influences by genes at many loci. Quantitative because it is determined by many loci (meristic) e. Number of fingers in humans. Extra fingers are caused by the presences of an autosomal dominant allele. Discontinuous characteristic because only a few distinct phenotypes are determined by alleles at a single locus 1060 Hixson-Lied Student Success Center 515-294-6624 sistaff@iastate.edu http://www.si.iastate.edu 17. The following data are the numbers of digits per foot in 25 guinea pigs. Construct a frequency distribution for the data: 4, 4, 4, 5, 3, 4, 3, 4, 4, 5, 4, 4, 3, 2, 4, 4, 5, 6, 4, 4, 3, 4, 4, 4, 5 Digits per foot in guinea pigs 16 14 12 10 8 6 4 2 0 2 digits/foot 3 digits/foot 4 digits/foot 5 digits/foot 6 digits/foot Series 1 1060 Hixson-Lied Student Success Center 515-294-6624 sistaff@iastate.edu http://www.si.iastate.edu
