Phys 552 Quantum Optics : Photodetectors
advertisement
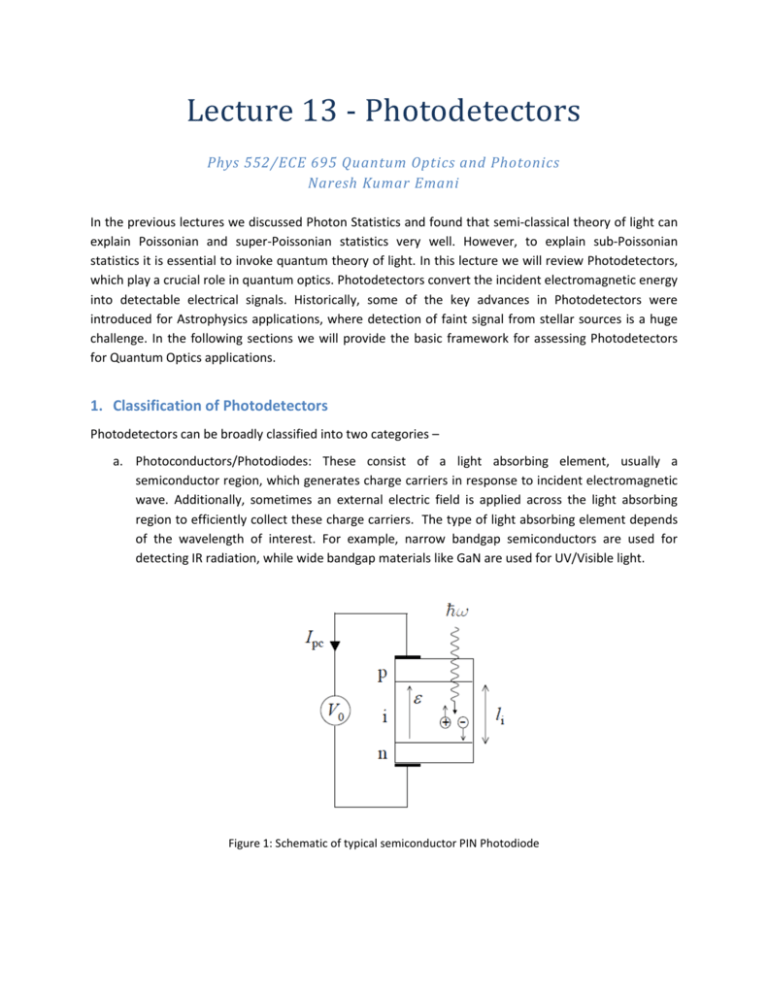
Lecture 13 - Photodetectors Phys 552/ECE 695 Quantum Optics and Photonics Naresh Kumar Emani In the previous lectures we discussed Photon Statistics and found that semi-classical theory of light can explain Poissonian and super-Poissonian statistics very well. However, to explain sub-Poissonian statistics it is essential to invoke quantum theory of light. In this lecture we will review Photodetectors, which play a crucial role in quantum optics. Photodetectors convert the incident electromagnetic energy into detectable electrical signals. Historically, some of the key advances in Photodetectors were introduced for Astrophysics applications, where detection of faint signal from stellar sources is a huge challenge. In the following sections we will provide the basic framework for assessing Photodetectors for Quantum Optics applications. 1. Classification of Photodetectors Photodetectors can be broadly classified into two categories – a. Photoconductors/Photodiodes: These consist of a light absorbing element, usually a semiconductor region, which generates charge carriers in response to incident electromagnetic wave. Additionally, sometimes an external electric field is applied across the light absorbing region to efficiently collect these charge carriers. The type of light absorbing element depends of the wavelength of interest. For example, narrow bandgap semiconductors are used for detecting IR radiation, while wide bandgap materials like GaN are used for UV/Visible light. Figure 1: Schematic of typical semiconductor PIN Photodiode b. Single Photon detectors: Single photon detectors are Photodetectors with extremely high sensitivity so as to detect single photon. Single photon detectors can be grouped into four main categories: photomultiplier tubes, semiconducting avalanche photodiodes, semiconducting quantum dot detectors and superconducting detectors1. Photomultiplier tubes are the most well-established of the technologies and have the best of performance metrics. However, these are typically bulky and there has been a surge of interest lately, in miniaturized single photon detectors due to potential applications in quantum information science. 2. Performance metrics for Photodetectors1 a. Spectral range: A photodetector is usually sensitive to only certain range of wavelengths depending on the energy bandgap of the constituent materials. Materials with a larger bandgap work in visible wavelengths, while materials with low bandgap work well in the infrared part of the spectrum. A particularly interesting class of materials is semi-metals like Hg which form chemical compounds like HgCdTe (MCT) and HgSe. These are widely employed in IR detectors because they exhibit tunable bandgap at IR wavelengths. Direct bandgap materials with typical absorption coefficients of 106 m-1 are better Photodetectors2. Their active areas are ~ 1 μm giving fast response time due to decreased carrier transit times. b. Detection Efficiency: Detection efficiency defines the number of counts registered for each incident photon. Ideally, the detector should have an efficiency of 1. In the quantum theory of Photodetection, the dependence of fluctuations in Photocounts (ΔN) as a function of fluctuation in number of photons (Δn) is given by where, η is the efficiency of the Photodetector. When the detector efficiency is 1 then the Photocounts faithfully reproduce the incident fluctuations i.e., ΔN= Δn. However, if the efficiency is low then (ΔN)2 = ηnavg giving Poissonian distribution of Photocounts irrespective incident statistics. Therefore, high efficiency detectors are essential for detection in single photon regime. c. Responsivity: Responsivity is the ratio of photocurrent to the incident optical power. An estimate of the responsivity of a photodetector could be obtained by considering an active length (l) of a photodetector illuminated by a light beam of optical power (P) and frequency (ω). The flux of photons per unit time is given by P/hbarω. From the definition of absorption the light absorbed in a length l is 1-eαl, where α is the absorption coefficient at the frequency ω. Since each absorbed photon leads to a electron-hole pair and η is the quantum efficiency, we can write the magnitude of photocurrent and responsivity as I pc e R I pc P 1 e P l e 1 e l From the above equations we can see that in order to obtain large responsivity detectors we need high quantum efficiency. Ideally η and 1-eαl should be 1, which sets a upper limit for the responsivity of the detector without amplification as e / . Table 1 lists several prominent types of detectors and their responsivity parameters. We see that PMTs are an example of high responsivity detectors with extremely small response times which is not matched by other detectors. d. Dark Current/Count rate: Practical Photodetectors have a finite probability of registering false counts, which could arise due to external noise, material properties of detector and/or biasing conditions. Usually PMTs are extremely low dark count rates and are most sensitive. Avalanche Photodiodes are generally noisy. In some cases additional techniques like lock-in detection or gating are essential to reach the intrinsic performance limits of the detector. e. Dead Time: Dead time is the time elapsed between registration of a photon count and the time detector is ready to detect the next photon count. Dead time is usually determined by the attached electronics rather than the intrinsic detector performance. For typical photodetector the dead time is around 1 μs. Therefore, this limits the photon counts to about 106 per second. Considering a typical efficiency of 10% we can see that photon counting procedure works only for extremely faint optical beams with optical powers of ~ 10-12 W or less. Detection of light beams with higher powers should be done with alternative methods as discussed later sections. f. Timing Jitter: Timing jitter is the variation of the delay between the absorption of the incident photon and the generation of the output pulse. Jitter in introduced by the randomness in the generation of the Photocounts. The table below compares the key parameters outlined above for several major detectors. 3. Measurements in single photon regime Vs High Photon Flux measurements3 As discussed earlier in the lecture single photon counting technique work only for very weak intensities of 10-12 W due to dead time limitations of current detectors. This translates to about 106 photons sec-1. In many cases like a regular 1mW He-Ne laser beam the photon flux is much higher in the range of 1015 photons sec-1. No detector can respond to such high photon fluxes and an alternative measurement strategy is required. The figure below illustrates a typical strategy employed to detect high photon flux beams. The incident beam produces a current which is amplified by electronics and observed as a voltage on the oscilloscope. The fluctuations in photon count causes the fluctuations in current Δi(t), whose power spectral density(PSD) given by Pnoise(t)=(Δi(t))2RL can be measured experimentally. A typical Noise PSD curve is shows two interesting regimes. In the high frequency limit the response is limited by the photodetector dead time given by 1/τD. In the low frequency limit there are many external sources like mechanical vibrations which dominate the spectrum. These contributions reduce as frequency increases and we observe a plateau determined by the shot noise. This can be understood by considering the photon count fluctuations in perfectly coherent beam given by ΔN= <N>. This would lead Noise PSD which depends on the average current as Pnoise(f)=2eRLΔf <i>, essentially independent of frequency. Therefore, this shot noise is sometimes called as ‘white’ noise. Typical noise spectrum for a Nd:YAG laser is shown below. We see that laser noise reaches the shot noise limit at around 15 MHz frequency. The noise power output at 50 MHz from a Ti:Sapphire laser operating at 930 nm is shown on the right. We see that the noise power increases with increasing power because of increase in average photon number. The lower limit of measurement is set by the electrical noise which is universally present. Sub-shot noise measurements As we have seen shot noise power is the best we can do with coherent optical beams. However when we have sub-Poissonian statistics, the noise level could be below shot noise limit. In fact this is considered as one of the proofs of non-classical sub-Poissonian light. A representative experiment showing confirmation of sub-Poissonian light by sub-shot noise measurements is shown below. 4. References 1. 2. 3. 15. Hadfield, R. H. Nature photonics 2009, 3, (12), 696-705. Mark, F., Optical properties of solids. Oxford University Press, New York: 2001. Fox, M., Quantum Optics: An Introduction: An Introduction. Oxford University Press: 2006; Vol.


