2014 Evaluation Year 8 achievement levels Award % of Students
advertisement
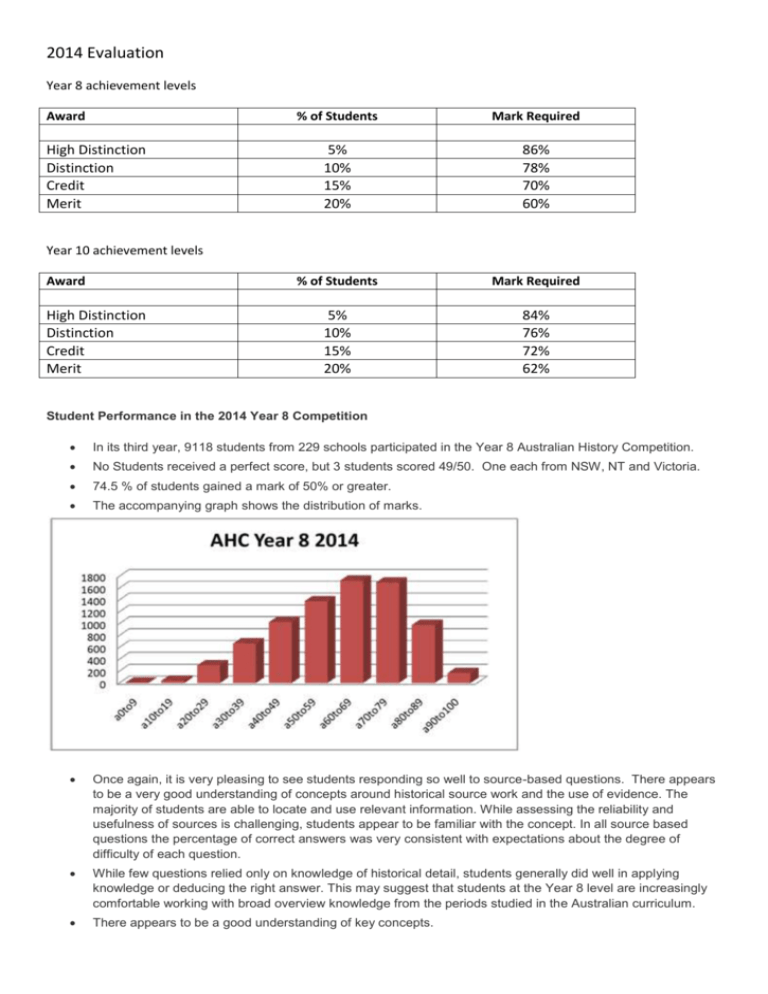
2014 Evaluation Year 8 achievement levels Award High Distinction Distinction Credit Merit % of Students Mark Required 5% 10% 15% 20% 86% 78% 70% 60% % of Students Mark Required 5% 10% 15% 20% 84% 76% 72% 62% Year 10 achievement levels Award High Distinction Distinction Credit Merit Student Performance in the 2014 Year 8 Competition In its third year, 9118 students from 229 schools participated in the Year 8 Australian History Competition. No Students received a perfect score, but 3 students scored 49/50. One each from NSW, NT and Victoria. 74.5 % of students gained a mark of 50% or greater. The accompanying graph shows the distribution of marks. Once again, it is very pleasing to see students responding so well to source-based questions. There appears to be a very good understanding of concepts around historical source work and the use of evidence. The majority of students are able to locate and use relevant information. While assessing the reliability and usefulness of sources is challenging, students appear to be familiar with the concept. In all source based questions the percentage of correct answers was very consistent with expectations about the degree of difficulty of each question. While few questions relied only on knowledge of historical detail, students generally did well in applying knowledge or deducing the right answer. This may suggest that students at the Year 8 level are increasingly comfortable working with broad overview knowledge from the periods studied in the Australian curriculum. There appears to be a good understanding of key concepts. While students appear to have a good broad grasp of chronology, they sometimes struggle to apply this understanding when asked to deal with the historical context of sources. Student Performance in the 2014 Year 10 Competition In its third year, 11384 students from 286 schools participated in the Year 10 Australian History Competition. No Students received a perfect score, but one student from West Australia scored 49/50. 81.9% of students gained a mark of 50% or greater. The accompanying graph shows the distribution of marks. With more reading than in 2013 and some arguably more challenging questions, student performance in 2014 was most impressive. While the number of correct responses to each question reflected their difficulty, the overall response suggests that students have a very good grasp of source work and are able to apply both skills and knowledge. The use of evidence and evaluation of sources demonstrated by many students suggests that they have a very good understanding of the skills and concepts outlined for Year 10 in the Australian curriculum. The 2014 paper provided a number of opportunities to work with statistical information and responses, to both lower order and higher order questions, were particularly encouraging. There appears to be a very good understanding of key concepts and an ability to apply them.


