Table S1 Information for all lakes involved in the experiment. Water
advertisement
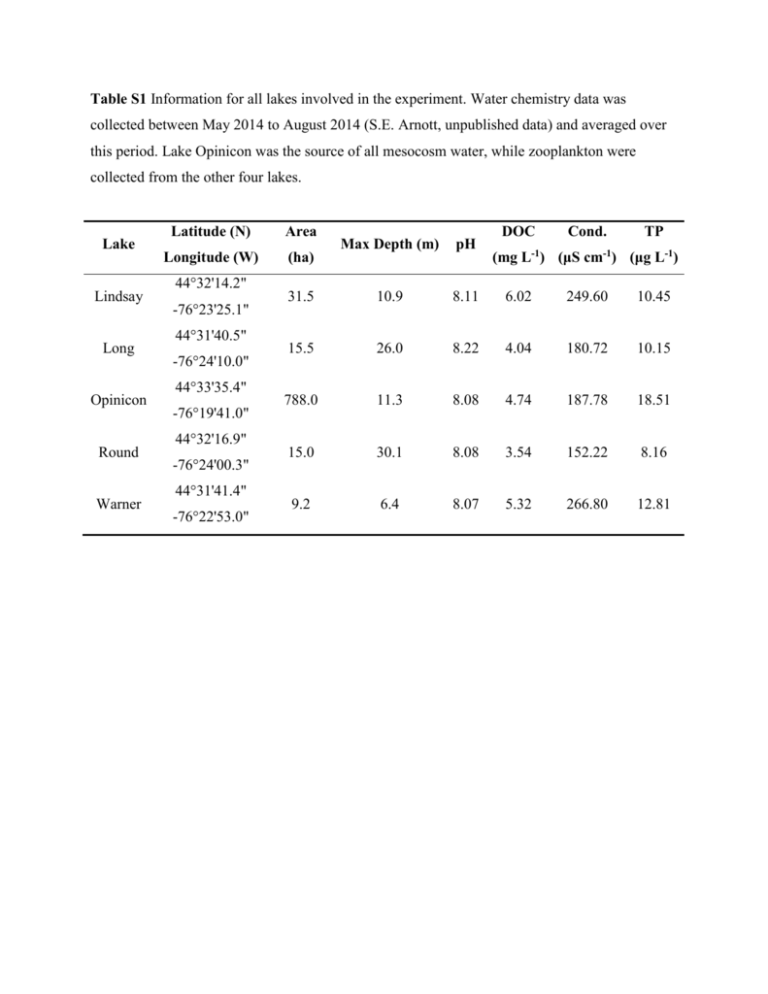
Table S1 Information for all lakes involved in the experiment. Water chemistry data was collected between May 2014 to August 2014 (S.E. Arnott, unpublished data) and averaged over this period. Lake Opinicon was the source of all mesocosm water, while zooplankton were collected from the other four lakes. Lake Lindsay Long Opinicon Round Warner Latitude (N) Area Longitude (W) (ha) 44°32'14.2" -76°23'25.1" 44°31'40.5" -76°24'10.0" 44°33'35.4" -76°19'41.0" 44°32'16.9" -76°24'00.3" 44°31'41.4" -76°22'53.0" DOC Cond. TP Max Depth (m) pH 31.5 10.9 8.11 6.02 249.60 10.45 15.5 26.0 8.22 4.04 180.72 10.15 788.0 11.3 8.08 4.74 187.78 18.51 15.0 30.1 8.08 3.54 152.22 8.16 9.2 6.4 8.07 5.32 266.80 12.81 (mg L-1) (μS cm-1) (μg L-1) Table S2 Minimum adequate model (MAM) structure, statistical methodology, descriptive statistics, and R2 values (calculated using the pseudo-R2 methods from Zuur et al. 2009) for abundance (through time) and presence/absence (4th week following 2-2.5 average growing weeks) models. ‘Size’, ‘Number’, and ‘Time’ entries under the ‘MAM’ heading represent the predictors that were retained in the MAMs. Metric Abundance – all weeks P/A – final week MAM Descriptive Statistics Mean: 2.4 Size*Number*Time Number Variance: 22.13 Minimum success: 0 Minimum failure: 3 Distribution R2 Zero inflated Negative Binomial 0.87 Zero inflated Binomial 0.77 Table S3 Abundance through time model coefficients. The propagule number category for the single addition treatments (Number – 1) is used as the base level of ‘Number’ in the model. Term Estimate SE Z-value P Intercept 0.9043 0.4459 2.03 0.04256 Size 0.0989 0.0262 3.78 0.00016 Time -0.5179 0.2086 -2.48 0.01302 Number – 2 0.6731 0.7507 0.90 0.36986 Number – 4 -0.5378 1.1429 -0.47 0.63795 Size:Time 0.0138 0.0117 1.18 0.23856 Size:Number – 2 -0.0472 0.0440 -1.07 0.28308 Size: Number – 4 0.0497 0.0685 0.73 0.46840 Time:Number – 2 -0.3273 0.3508 -0.93 0.35083 Time:Number – 4 0.3331 0.6062 0.55 0.58262 Size:Time:Number – 2 0.0136 0.0200 0.68 0.49603 Size:Time:Number – 4 -0.0868 0.0384 -2.26 0.02398 Fig. S1 Daytime average temperature (solid line) and overall average (dashed line) for the QUBS area over the period in which the experiment was conducted. Note that the field site was shaded, and cover was provided to all tanks, which would lead to cooler temperatures than those shown and reduce daily fluctuations. Fig. S2 Temperature variability (July 4th – August 31st) at QUBS within each day (measured every 15 minutes) and within each week (8 total weeks) for the period over which the experiment was conducted.
