Homework 6
advertisement
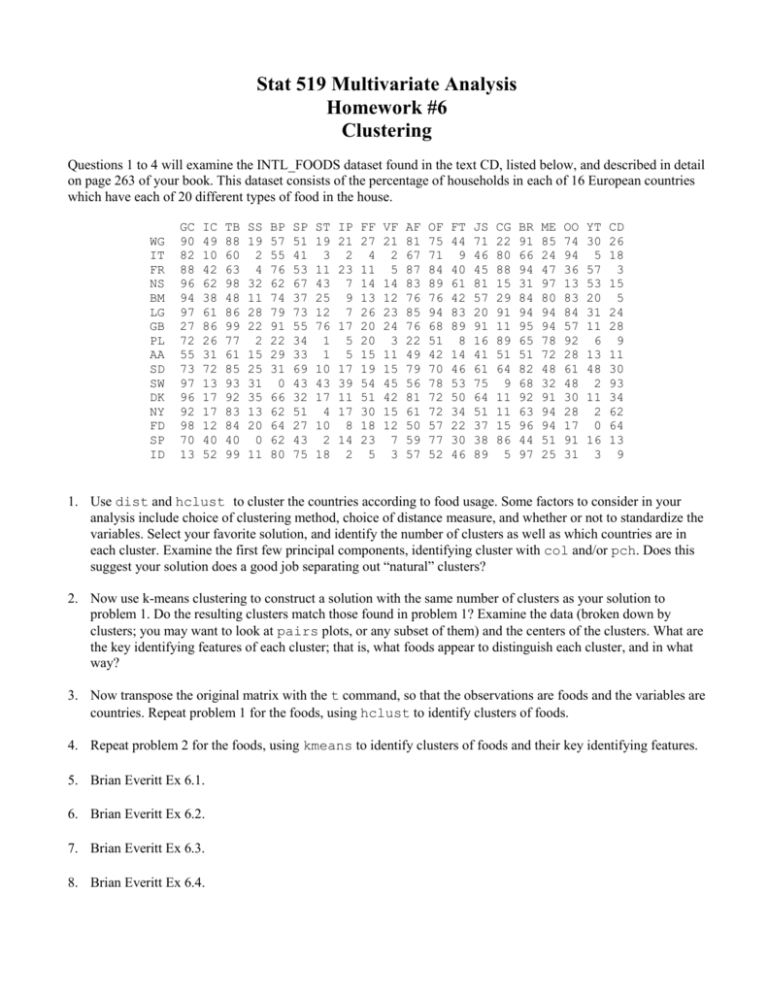
Stat 519 Multivariate Analysis Homework #6 Clustering Questions 1 to 4 will examine the INTL_FOODS dataset found in the text CD, listed below, and described in detail on page 263 of your book. This dataset consists of the percentage of households in each of 16 European countries which have each of 20 different types of food in the house. WG IT FR NS BM LG GB PL AA SD SW DK NY FD SP ID GC 90 82 88 96 94 97 27 72 55 73 97 96 92 98 70 13 IC 49 10 42 62 38 61 86 26 31 72 13 17 17 12 40 52 TB 88 60 63 98 48 86 99 77 61 85 93 92 83 84 40 99 SS 19 2 4 32 11 28 22 2 15 25 31 35 13 20 0 11 BP 57 55 76 62 74 79 91 22 29 31 0 66 62 64 62 80 SP 51 41 53 67 37 73 55 34 33 69 43 32 51 27 43 75 ST 19 3 11 43 25 12 76 1 1 10 43 17 4 10 2 18 IP 21 2 23 7 9 7 17 5 5 17 39 11 17 8 14 2 FF 27 4 11 14 13 26 20 20 15 19 54 51 30 18 23 5 VF 21 2 5 14 12 23 24 3 11 15 45 42 15 12 7 3 AF 81 67 87 83 76 85 76 22 49 79 56 81 61 50 59 57 OF 75 71 84 89 76 94 68 51 42 70 78 72 72 57 77 52 FT 44 9 40 61 42 83 89 8 14 46 53 50 34 22 30 46 JS 71 46 45 81 57 20 91 16 41 61 75 64 51 37 38 89 CG 22 80 88 15 29 91 11 89 51 64 9 11 11 15 86 5 BR 91 66 94 31 84 94 95 65 51 82 68 92 63 96 44 97 ME 85 24 47 97 80 94 94 78 72 48 32 91 94 94 51 25 OO 74 94 36 13 83 84 57 92 28 61 48 30 28 17 91 31 YT 30 5 57 53 20 31 11 6 13 48 2 11 2 0 16 3 CD 26 18 3 15 5 24 28 9 11 30 93 34 62 64 13 9 1. Use dist and hclust to cluster the countries according to food usage. Some factors to consider in your analysis include choice of clustering method, choice of distance measure, and whether or not to standardize the variables. Select your favorite solution, and identify the number of clusters as well as which countries are in each cluster. Examine the first few principal components, identifying cluster with col and/or pch. Does this suggest your solution does a good job separating out “natural” clusters? 2. Now use k-means clustering to construct a solution with the same number of clusters as your solution to problem 1. Do the resulting clusters match those found in problem 1? Examine the data (broken down by clusters; you may want to look at pairs plots, or any subset of them) and the centers of the clusters. What are the key identifying features of each cluster; that is, what foods appear to distinguish each cluster, and in what way? 3. Now transpose the original matrix with the t command, so that the observations are foods and the variables are countries. Repeat problem 1 for the foods, using hclust to identify clusters of foods. 4. Repeat problem 2 for the foods, using kmeans to identify clusters of foods and their key identifying features. 5. Brian Everitt Ex 6.1. 6. Brian Everitt Ex 6.2. 7. Brian Everitt Ex 6.3. 8. Brian Everitt Ex 6.4.


