Number
advertisement
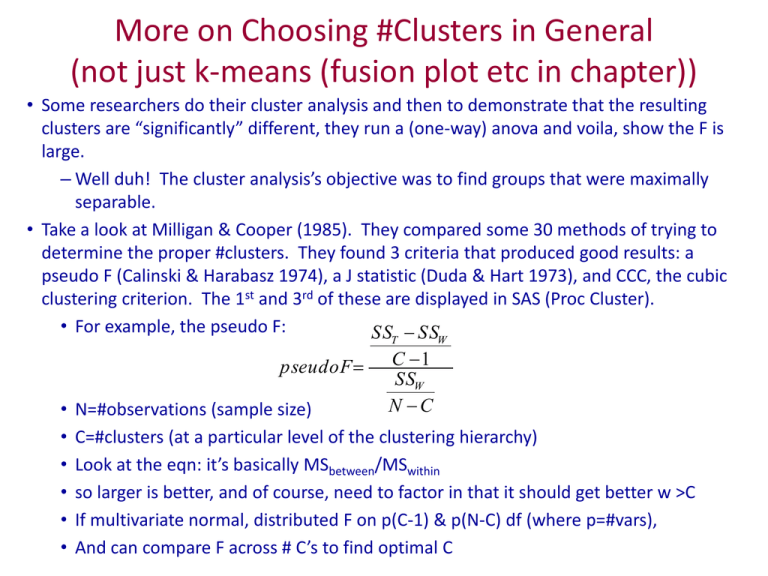
More on Choosing #Clusters in General (not just k-means (fusion plot etc in chapter)) • Some researchers do their cluster analysis and then to demonstrate that the resulting clusters are “significantly” different, they run a (one-way) anova and voila, show the F is large. – Well duh! The cluster analysis’s objective was to find groups that were maximally separable. • Take a look at Milligan & Cooper (1985). They compared some 30 methods of trying to determine the proper #clusters. They found 3 criteria that produced good results: a pseudo F (Calinski & Harabasz 1974), a J statistic (Duda & Hart 1973), and CCC, the cubic clustering criterion. The 1st and 3rd of these are displayed in SAS (Proc Cluster). • For example, the pseudo F: SS SS T pseudoF • • • • • • C 1 SSW N C W N=#observations (sample size) C=#clusters (at a particular level of the clustering hierarchy) Look at the eqn: it’s basically MSbetween/MSwithin so larger is better, and of course, need to factor in that it should get better w >C If multivariate normal, distributed F on p(C-1) & p(N-C) df (where p=#vars), And can compare F across # C’s to find optimal C More on Choosing #Clusters in General • References – Breckenridge, James N. (2000), “Validating Cluster Analysis: Consistent Replication and Symmetry,” Multivariate Behavioral Research, 35 (2), 261-285. – Calinski, R. B. and J. Harabasz (1974), “A Dendrite Method for Cluster Analysis,” Communications in Statistics, 3, 1-27. – Krolak-Schwerdt, Sabine and Thomas Eckes (1992), “A Graph Theoretic Criterion for Determining the Number of Clusters in a Data Set,” Multivariate Behavioral Research, 27 (4), 541-565. – Milligan, Glenn W. and Martha C. Cooper (1985), “An Examination of Procedures for Determining the Number of Clusters in a Data Set,” Psychometrika, 50, 159-179. – Steinley, Douglas and Michael J. Brusco (2011), “Choosing the Number of Clusters in K-Means Clustering,” Psychological Methods, 16 (3), 285-297.


