ddi12264-sup-0006
advertisement
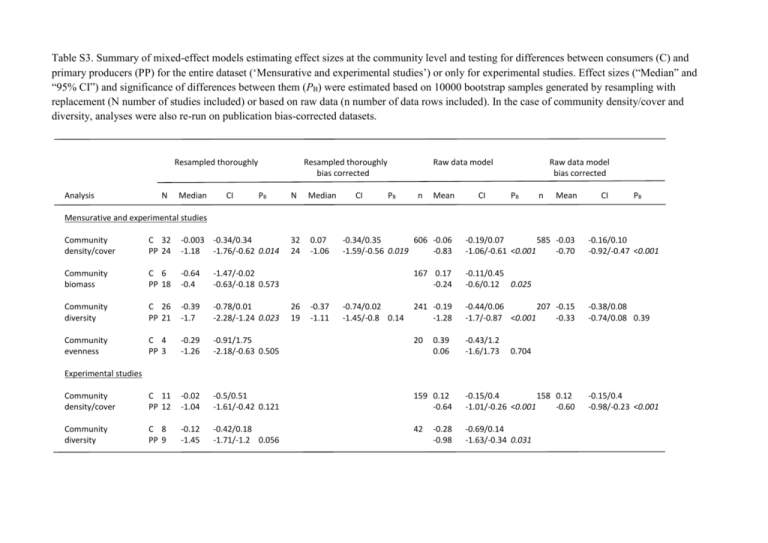
Table S3. Summary of mixed-effect models estimating effect sizes at the community level and testing for differences between consumers (C) and primary producers (PP) for the entire dataset (‘Mensurative and experimental studies’) or only for experimental studies. Effect sizes (“Median” and “95% CI”) and significance of differences between them (PB) were estimated based on 10000 bootstrap samples generated by resampling with replacement (N number of studies included) or based on raw data (n number of data rows included). In the case of community density/cover and diversity, analyses were also re-run on publication bias-corrected datasets. Resampled thoroughly Analysis N Median CI Resampled thoroughly bias corrected PB N Median 32 24 0.07 -1.06 CI Raw data model PB n Mean CI Raw data model bias corrected PB n Mean CI PB Mensurative and experimental studies Community density/cover C 32 PP 24 -0.003 -0.34/0.34 -1.18 -1.76/-0.62 0.014 Community biomass C 6 PP 18 -0.64 -0.4 -1.47/-0.02 -0.63/-0.18 0.573 Community diversity C 26 PP 21 -0.39 -1.7 -0.78/0.01 -2.28/-1.24 0.023 Community evenness C 4 PP 3 -0.29 -1.26 Community density/cover C 11 PP 12 Community diversity C 8 PP 9 -0.34/0.35 606 -0.06 -1.59/-0.56 0.019 -0.83 -0.19/0.07 585 -0.03 -1.06/-0.61 <0.001 -0.70 167 0.17 -0.24 -0.11/0.45 -0.6/0.12 0.025 241 -0.19 -1.28 -0.44/0.06 207 -0.15 -1.7/-0.87 <0.001 -0.33 -0.91/1.75 -2.18/-0.63 0.505 20 -0.43/1.2 -1.6/1.73 -0.02 -1.04 -0.5/0.51 -1.61/-0.42 0.121 159 0.12 -0.64 -0.15/0.4 158 0.12 -1.01/-0.26 <0.001 -0.60 -0.12 -1.45 -0.42/0.18 -1.71/-1.2 0.056 42 -0.69/0.14 -1.63/-0.34 0.031 26 19 -0.37 -1.11 -0.74/0.02 -1.45/-0.8 0.14 0.39 0.06 -0.16/0.10 -0.92/-0.47 <0.001 -0.38/0.08 -0.74/0.08 0.39 0.704 Experimental studies -0.28 -0.98 -0.15/0.4 -0.98/-0.23 <0.001

