SUPPLEMENTAL_MATERIALS
advertisement
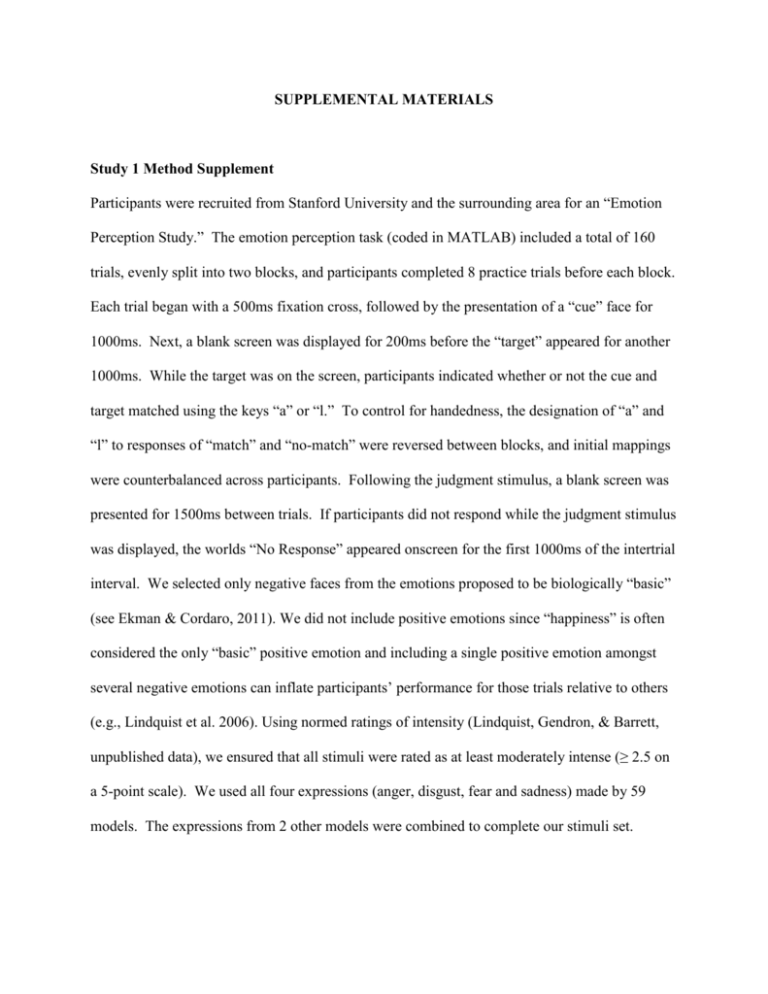
SUPPLEMENTAL MATERIALS Study 1 Method Supplement Participants were recruited from Stanford University and the surrounding area for an “Emotion Perception Study.” The emotion perception task (coded in MATLAB) included a total of 160 trials, evenly split into two blocks, and participants completed 8 practice trials before each block. Each trial began with a 500ms fixation cross, followed by the presentation of a “cue” face for 1000ms. Next, a blank screen was displayed for 200ms before the “target” appeared for another 1000ms. While the target was on the screen, participants indicated whether or not the cue and target matched using the keys “a” or “l.” To control for handedness, the designation of “a” and “l” to responses of “match” and “no-match” were reversed between blocks, and initial mappings were counterbalanced across participants. Following the judgment stimulus, a blank screen was presented for 1500ms between trials. If participants did not respond while the judgment stimulus was displayed, the worlds “No Response” appeared onscreen for the first 1000ms of the intertrial interval. We selected only negative faces from the emotions proposed to be biologically “basic” (see Ekman & Cordaro, 2011). We did not include positive emotions since “happiness” is often considered the only “basic” positive emotion and including a single positive emotion amongst several negative emotions can inflate participants’ performance for those trials relative to others (e.g., Lindquist et al. 2006). Using normed ratings of intensity (Lindquist, Gendron, & Barrett, unpublished data), we ensured that all stimuli were rated as at least moderately intense (≥ 2.5 on a 5-point scale). We used all four expressions (anger, disgust, fear and sadness) made by 59 models. The expressions from 2 other models were combined to complete our stimuli set. Analysis of Study 1 Stimuli As cited in the article’s main text, several studies demonstrate that posed expressions of fear differ substantially from other faces, particularly because they involve widened eyes and visible sclera (Ekman, Friesen, & Hager, 2002). For example, Jack, Garrod, & Schyns (2014) demonstrate that fear and surprise faces are perceived as distinct from other expressions because they involve raised upper eyelids early in the expression; Adolphs, et al. (2005) show that attention to the eyes is critical for identifying fear expressions; Somerville & Whalen (2006) discovered that undergraduate participants report hardly ever seeing fear faces in their everyday lives; and neuroimaging studies demonstrate that visual attention (modulated via amygdala projections to visual cortex) is disproportionately directed to fearful faces (Whalen, et al., 2004), especially when the gaze is direct (Adams et al., 2003). Hence, fear faces seem to be visually and psychologically dissimilar from those of other emotions. To further corroborate this position, we performed a metric analysis of the facial stimuli used in Study 1. We used Abrosoft FantaMorph to define the location of critical facial structures on stimuli from the 59 models for whom we used all four emotion expressions. Using a total of 74 points, we identified the location of the eyebrows (16 points), eyes (22 points), nose (16 points) and mouth (20 points) in an x/y coordinate system. We then used coordinate geometry to quantify the distance each model’s facial features had to move for them to transition between each emotion expression. This resulted in six facial movement measures for each model (i.e., fear-anger, fear-disgust, fear-sadness, anger-disgust, anger-sadness and disgust-sadness). One-way Repeated Measures ANOVAs indicated that facial movement scores were not equal across emotion pairs [F(5,290) = 8.35, p < .001, ηp2 = .13, Figure S1a]. Visual inspection of these data suggested that facial movement may be greater when transitioning between fear and a non-fear emotion than when transitioning between two non-fear emotions. We thus computed two facial movement composite scores for each model, one which averaged facial movement for emotion pairs involving fear (i.e., fear-anger, fear-disgust or fear-sadness) and one for pairs not involving fear (i.e., anger-disgust, anger-sadness or disgust-sadness). A paired-samples t-test indicated that overall facial movement is indeed higher when models must transition from fear to a non-fear emotion than when they transition between two non-fear emotions [t(58) = 3.39, p = .001, d = .32]. Follow-up analyses focused on testing whether the eyebrow and eye regions were driving these dissimilarities across expressions. Hence, we created eyebrow movement and eye movement scores by calculating the distance that points surrounding the eyebrows and eyes had to travel to transition between each emotion. As expected, one-way repeated measures ANOVAs demonstrated that average eyebrow movement [F(5,290) = 37.24, p < .001, ηp2 = .39, Figure S1b] and eye movement [F(5,290) = 3.80, p = .002, ηp2 = .39, Figure S1c] scores were significantly different across emotion pairings. We then averaged eyebrow movement and eye movement scores for pairs involving fear and those not involving fear. Paired-samples t-tests revealed that both the eyebrows [t(58) = 7.25, p < .001, d = .91] and the eyes [t(58) = 2.53, p = .01, d = .22] moved more when models transitioned from fear to a non-fear emotion than when they transitioned between two non-fear emotions. Hence, a metric analysis of our own stimuli suggests that fear faces are less visually similar to expressions of other emotions, particularly due to movement in the eye region. These results corroborate our claim that fear expressions are dissimilar from other expressions and should consequently be analyzed separately in Study 1 and excluded in Study 2. 20 15 10 5 0 35 c) 30 25 20 15 10 5 Mean Eye Movement (pixels) b) Mean Eyebrow Movement (pixels) a) Mean Facial Movement (pixels) Supplemental Figure 1 (Analysis of Study 1 Stimuli) 14 12 10 8 6 4 2 0 0 Supplemental Fig. 1. Average facial movement required for models to transition between each emotion used as stimuli in Study 1. Transitions involving fear (dark orange) are grouped on the left, whereas transitions involving emotions other than fear are grouped on the right (light orange). Results are further split according to facial region: a) movement of all points on the face, b) movement of points around the eyebrows only and c) movement of points around the eyes only. Error bars represent SEM. Supplemental Figure 2 (Analyses of Study 2 Repetition-Priming Task) a) 0.80 Congruent Incongruent 1.4 1.2 1 0.70 Mean Sensitivity Mean RT (s) 0.75 b) 0.65 0.60 0.55 0.8 0.6 0.4 0.2 0.50 0 Face-Face Trials c) Face-Word Trials Face-Face Trials Face-Word Trials Face Targets 2.5 Word Targets 2 Sensitivity 1.5 1 0.5 0 12 -0.5 19 26 Alexithymia Supplemental Fig. 2. Analyses of dependent variables in Study 2’s Repetition-Priming Task. a) Mean RTs for each condition; b) mean sensitivity scores for face-face and face-word pairs; c) scatter plot showing each participant’s average sensitivity score and their alexithymia score, with separate trend lines for participants in the face-face and face-word conditions. Error bars represent SEM. Supplemental Table 1: Means and standard deviations of signal detection measures HR FAR d’ c 0.68 (0.13) 0.33 (0.13) 0.96 (0.47) -0.01 (0.31) Visually Similar - 0.39 (0.15) 0.79 (0.50) -0.10 (0.33) Visually Dissimilar - 0.27 (0.15) 1.16 (0.56) 0.09 (0.33) 0.64 (0.14) 0.21 (0.11) 1.26 (0.60) 0.24 (0.28) Visually Similar - 0.23 (0.12) 1.20 (0.66) 0.21 (0.28) Visually Dissimilar - 0.19 (0.12) 1.33 (0.61) 0.28 (0.31) Face-Face Trials 0.57 (0.14) 0.31 (0.12) 0.72 (0.42) 0.16 (0.31) Face-Word Trials 0.63 (0.11) 0.24 (0.11) 1.11 (0.52) 0.21 (0.23) Condition Study 1 Face-Face Trials Face-Word Trials Study 2 Notes: HR = Hit Rate, FAR = False Alarm Rate, d’ = sensitivity, c = bias, numbers in parentheses are standard deviations.
