Supplemental material
Fragmentation mechanism of UV-excited peptides in the gas phase
Aleksandra V. Zabuga, Michael Z. Kamrath, Oleg V. Boyarkine, and Thomas R. Rizzo
Laboratoire de Chimie Physique Moléculaire, École Polytechnique Fédérale de Lausanne, EPFL SB ISIC LCPM,
Station 6, CH-1015 Lausanne, Switzerland
SUPPLEMENTAL MATERIAL
FIG. S1. Mass spectra of AcFA
5
K-H + showing the photofragments generated upon UV excitation (lower trace) and upon UV excitation with subsequent IR OPO excitation (upper trace). The UV laser is fixed at the band origin of conformer B (37555.3 cm -1 ). The IR OPO fires 600 ns after the UV laser and is tuned to 3570 cm -1 , which corresponds to the COOH stretch vibration.
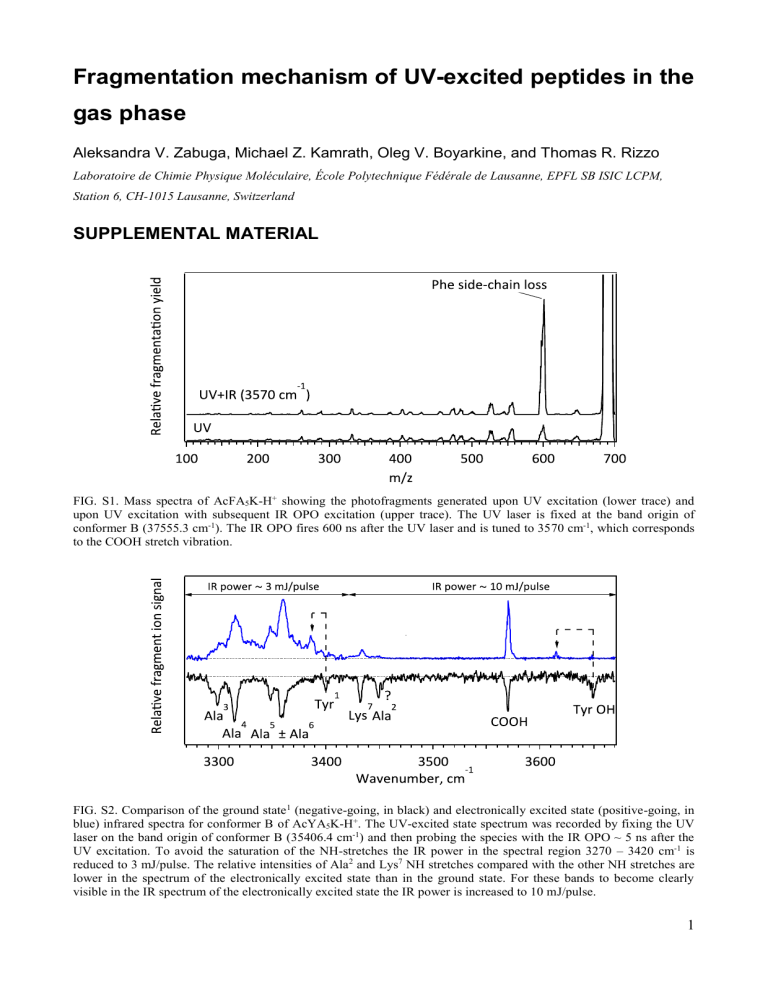
FIG. S2. Comparison of the ground state 1 (negative-going, in black) and electronically excited state (positive-going, in blue) infrared spectra for conformer B of AcYA
5
K-H + . The UV-excited state spectrum was recorded by fixing the UV laser on the band origin of conformer B (35406.4 cm -1 ) and then probing the species with the IR OPO ~ 5 ns after the
UV excitation. To avoid the saturation of the NH-stretches the IR power in the spectral region 3270 – 3420 cm -1 is reduced to 3 mJ/pulse. The relative intensities of Ala 2 and Lys 7 NH stretches compared with the other NH stretches are lower in the spectrum of the electronically excited state than in the ground state. For these bands to become clearly visible in the IR spectrum of the electronically excited state the IR power is increased to 10 mJ/pulse.
1
FIG. S3. Infrared spectra of electronically excited AcYA
5
K-H + depicting how the species evolves in time. The UV laser is fixed at the band origin of conformer B (35406.4 cm -1 ), while the infrared OPO probes the electronically excited species at the indicated time delays.
60
50
40
AcFA
AcFA
5
5
K in a cold 22-pole
K in a cold octopole
30
20
10
0
0.0
0.1
0.2
0.3
Delay UV-IR, ms
0.4
20 40 60
FIG. S4. Infrared-induced enhancement of the chromophore side-chain loss fragment intensity for AcFA
5
K-H + in a
22-pole ion trap (green) and in an octopole ion trap (red) as a function of the UV-IR time delay. Both traps are cooled to
~4 K. The UV laser is fixed on the band origin of conformer B (37555.3 cm -1 ) while the infrared OPO is fixed at
3391 cm -1 . We used 12 mJ/pulse of IR power in the 22-pole trap and 8 mJ/pulse in the octopole trap. The total IRinduced enhancement in an octopole ion trap is multiplied by a factor of 3 for comparison reasons.
2
(b)
T
1
S
0
C f B
(a)
T
1
3 la
4 la 5 la
6 la
P
1 e y
7 s
2 la
S
0
3 la 4 la
5 la
6 la
P
1 e y
7 s
2 la
3 0 3 0 v n b
3 0
Conf B S
0
(2.6) Conf B T
1
3 0
(342.4)
(d)
T
1 o f D
S
0
(c)
T
1
3 la
3 la
5 la
6 la
5 la
6 la
4 la
P
1 e y
7 s
4 la
P
1 e y
7 s
2 la
2 la
S
0
3 0 3 0 v n b
3 0
Conf D S
0
(0.0) Conf D T
1
3 0
(339.6)
FIG. S5. AcFA
5
K-H + . The UV laser excites the band origin of conformer B (37555.3 cm -1 ) or conformer D (37551.4 cm -1 ). (a) The calculated ground state spectrum of conformer B from ref. 2 vs. the spectrum of the lowest triplet state of conformer B calculated at the DFT UB3LYP/6-31G** level of theory. (b) The experimental ground state spectrum of conformer B (in black) vs the experimental spectrum recorded 65 ms after the UV excitation (in green). (c) The calculated ground state spectrum of conformer D from ref. 2 vs. the spectrum of the lowest triplet state of conformer D calculated at the DFT UB3LYP/6-31G** level of theory. (d) The experimental ground state spectrum of conformer D
(in black) vs the experimental spectrum recorded 65 ms after the UV excitation (in green). For each calculated spectrum we present the structures below, with their zero-point energy corrected relative energies in kJ/mol. The calcualted harmonic frequencies are scaled by a factor 0.952.
References
1
2
M. Guidi, Ph. D. thesis, EPFL, Lausanne, 2010.
J. A. Stearns, C. Seaiby, O. V. Boyarkin, and T. R. Rizzo, Physical Chemistry Chemical
Physics 11 , 125 (2009).
3
