FTIR Spectroscopy (Fourier Transform Infrared)
advertisement
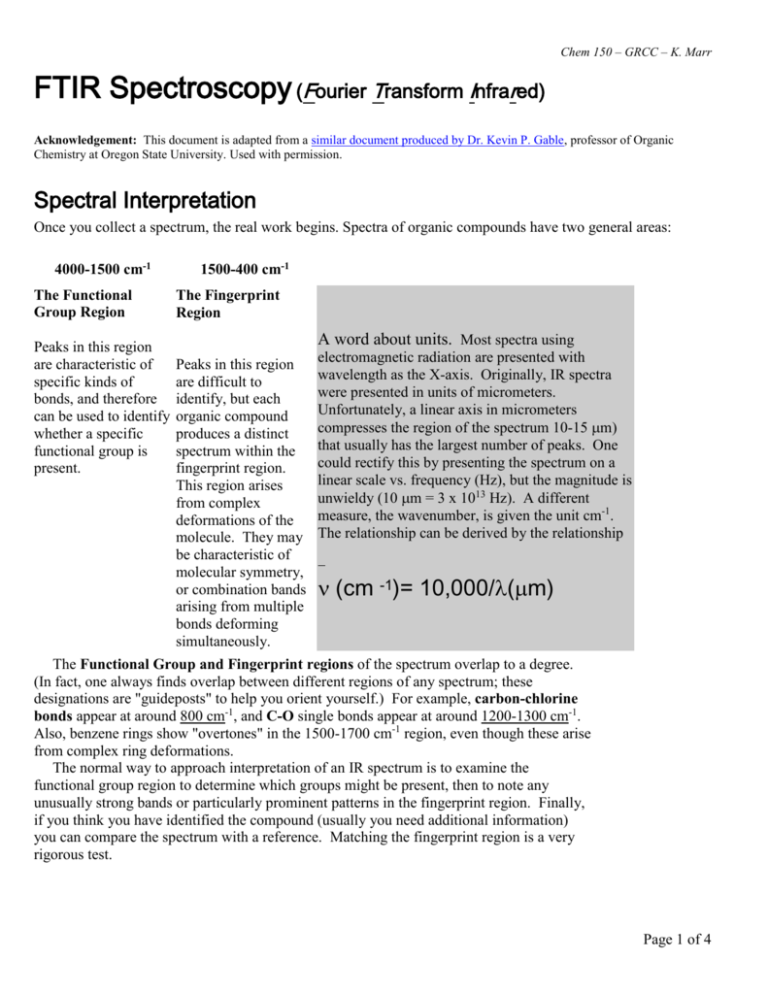
Chem 150 – GRCC – K. Marr FTIR Spectroscopy (Fourier Transform Infrared) Acknowledgement: This document is adapted from a similar document produced by Dr. Kevin P. Gable, professor of Organic Chemistry at Oregon State University. Used with permission. Spectral Interpretation Once you collect a spectrum, the real work begins. Spectra of organic compounds have two general areas: 4000-1500 cm-1 The Functional Group Region Peaks in this region are characteristic of specific kinds of bonds, and therefore can be used to identify whether a specific functional group is present. 1500-400 cm-1 The Fingerprint Region A word about units. Most spectra using Peaks in this region are difficult to identify, but each organic compound produces a distinct spectrum within the fingerprint region. This region arises from complex deformations of the molecule. They may be characteristic of molecular symmetry, or combination bands arising from multiple bonds deforming simultaneously. electromagnetic radiation are presented with wavelength as the X-axis. Originally, IR spectra were presented in units of micrometers. Unfortunately, a linear axis in micrometers compresses the region of the spectrum 10-15 m) that usually has the largest number of peaks. One could rectify this by presenting the spectrum on a linear scale vs. frequency (Hz), but the magnitude is unwieldy (10 m = 3 x 10¹³ Hz). A different measure, the wavenumber, is given the unit cm-1. The relationship can be derived by the relationship (cm -1)= 10,000/(m) The Functional Group and Fingerprint regions of the spectrum overlap to a degree. (In fact, one always finds overlap between different regions of any spectrum; these designations are "guideposts" to help you orient yourself.) For example, carbon-chlorine bonds appear at around 800 cm-1, and C-O single bonds appear at around 1200-1300 cm-1. Also, benzene rings show "overtones" in the 1500-1700 cm-1 region, even though these arise from complex ring deformations. The normal way to approach interpretation of an IR spectrum is to examine the functional group region to determine which groups might be present, then to note any unusually strong bands or particularly prominent patterns in the fingerprint region. Finally, if you think you have identified the compound (usually you need additional information) you can compare the spectrum with a reference. Matching the fingerprint region is a very rigorous test. Page 1 of 4 Chem 150 – GRCC – K. Marr Some important IR-active functional groups and examples of spectra Group Region Examples of spectra. (Try to find the characteristic peaks.) 3000-3100 cm-1 (sp2) C-H 2800-3000 cm-1 (sp3) 1600-1800 cm-1 C=O Acids: 16501700 Esters: 17401750 Aldehydes: 1720-1750 Ketones: 1720-1750 Amides:16501715 3300-3600 cm-1 Monomeric forms: sharp. O-H (alcohol) H-bonding between molecules leads to broadening. Page 2 of 4 Chem 150 – GRCC – K. Marr O-H (acids) CC C C-O 2400-3000 cm-1 Very broad, medium intensity 2200-2100 cm-1 Usually weak; maybe not visible in internal alkynes. Nitriles are quite strong. 1200-1300 cm-1 Often difficult to assign, depending on fingerprint region. Page 3 of 4 Chem 150 – GRCC – K. Marr N-H 3400 cm-1 Usually sharper than O-H. A final word about symmetry. Molecular vibrations give rise to IR bands only if they cause a change in the dipole moment of the molecule. (This comes out of the quantum mechanics of molecular absorption of energy, so we aren't concerned too much with why, yet.) If a stretch does not change the dipole moment, there won't be any IR band. This is why O2 and N2 in the atmosphere don't show any IR bands. CO2, however, has a stretch where one O moves in and the other moves out: Thus we see this band at 2400 cm-1. Page 4 of 4
