file - BioMed Central
advertisement
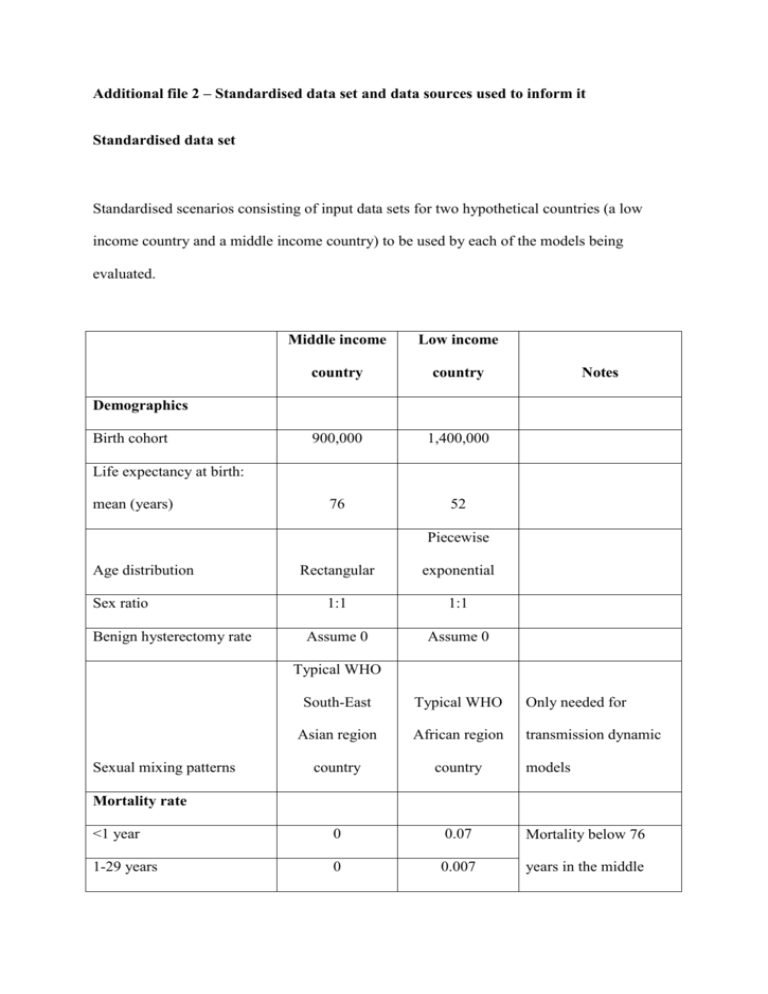
Additional file 2 – Standardised data set and data sources used to inform it Standardised data set Standardised scenarios consisting of input data sets for two hypothetical countries (a low income country and a middle income country) to be used by each of the models being evaluated. Middle income Low income country country 900,000 1,400,000 76 52 Notes Demographics Birth cohort Life expectancy at birth: mean (years) Piecewise Age distribution Sex ratio Benign hysterectomy rate Rectangular exponential 1:1 1:1 Assume 0 Assume 0 Typical WHO South-East Typical WHO Only needed for Asian region African region transmission dynamic country country <1 year 0 0.07 Mortality below 76 1-29 years 0 0.007 years in the middle Sexual mixing patterns models Mortality rate 30-75 years 0 0.03 income country is 0 (rectangular age 76+ years 1 1 distribution). 15-24 years 0.0111 0.0773 Ignore HPV prevalence 25-34 years 0.0128 0.0645 if model does not use it 35-44 years 0.0089 0.0510 as an input parameter, 45-54 years 0.0079 0.0390 but use AT LEAST one 55-64 years 0.0069 0.0330 of HPV prevalence and >64 years 0.0057 0.0330 cervical cancer HPV 16 prevalence incidence HPV 18 prevalence 15-24 years 0.0015 0.0670 25-34 years 0.0017 0.0559 35-44 years 0.0012 0.0442 45-54 years 0.0010 0.0338 55-64 years 0.0009 0.0286 >64 years 0.0008 0.0286 15-44 years 0.00013 0.00025 Ignore cervical cancer 45-54 years 0.00052 0.00135 incidence if model does 55-64 years 0.00063 0.00166 not use it as an input HPV 16/18-related cervical cancer incidence parameter, but use AT >64 years 0.00050 0.00155 LEAST one of HPV prevalence and cervical cancer incidence Screening Pap / visual Assume that the AFRO inspection country has no (modelMethod dependent) organised screening Not applicable opportunistic screening Model Sensitivity dependent and minimal Not applicable Model Specificity Sensitivity (invasive cancer) dependent Not applicable 1 Not applicable 1 Not applicable Specificity (invasive cancer) Assume same Model individuals screened at dependenta 0% Target age groups 30 to 45 Not applicable Frequency 5 yearly Not applicable 20% 41% Coverage every interval Vaccination Coverage (3 doses at year 0) Use year 10 coverage at year 0 if model does Coverage (3 doses at year not accommodate step- 10) 80% 87% Vaccine efficacy vs vaccine 100% 100% up type infection Duration of protection Lifelong Lifelong 15 10 Up to 26 None 0-2-6 months 0-2-6 months $4,000 $1,400 Vaccine (dose) $20 $20 Administration (dose) $0 0 Pap: CIN1 true positive $70 Not applicable Pap: CIN2/3 true positive $138 Not applicable Age group Age group (catch-up) Delivery Costs GDP per capita (exchange rate parity) Same as cost of a single Pap: False positive $3 Not applicable Pap: Negative $2 Not applicable VIA: CIN1 true positive $69 Not applicable VIA: CIN2/3 true positive $137 Not applicable Pap smear Same as cost of a single VIA: False positive $3 Not applicable VIA: Negative $1 Not applicable VIA test Models using cancer staging can retain their Cancer treatment (per episode, over lifetime) structure as long as the $1,815 $385 mean cost per episode is as given here Utility weights No HPV related disease Having had a hysterectomy 0 0 0.18 0.18 perfect health. Assume no utility decrements Diagnosed cancer (Stages IIII) As decrement from 0.08 0.08 for screening and treatment of pre- Diagnosed cancer (Stage IV) 0.75 0.75 cancerous lesions Diagnosed cancer (terminal) 0.81 0.81 (unless it involves Post-cancer survival 0.11 0.17 hysterectomy) Discount rate costs 3% 3% Discount rate benefits 3% 3% Health care Health care provider provider Direct only Direct only As long as As long as possible possible 0%, 4% 0%, 4% protection 20 years 20 years Vaccine cost x0.5, x2 x0.5, x2 Cost of screening and pre- x0.5, x2 x0.5, x2 Economic assumptions Perspective Costs Time horizon Sensitivity analyses Discount rate Mean duration of vaccine cancer treatment Cost of cancer treatment x0.5, x2 x0.5, x2 from perfect health) x0.5, x2 x0.5, x2 HPV prevalence x0.5, x2 x0.5, x2 Utility weights (decrement a Actual coverage levels for middle income country: GSK model 40% VIA, Merck model 20% Pap 20% VIA, Harvard 40% VIA, South Africa 50% Pap, Thai 40% Pap, WHO CHOICE 20% Pap 20% VIA. Data sources used to inform the standardised data sets The data sets given to model developers were hypothetical and not meant to inform decision making for any actual country. However, they were to some extent based on data from real countries. The hypothetical low-income country was composed from data on several low income countries in the WHO African region (Malawi, Mozambique, Tanzania, Uganda and Zambia), while the hypothetical middle-income country composed from data on several lower middle income countries in the WHO South-East Asia and Western Pacific regions (Indonesia, the Philippines, Thailand and Vietnam). Details of the sources for key parameters are provided below. Parameter Birth cohort (millions) Low income country Middle income country Value Sources Value Sources 0.9 Thailand: 0.87 1.4 Tanzania: 1.38 [1] Mean female life 76 Indonesia: 69 [1] 52 Malawi: 54 expectancy at birth (years) Philippines: Tanzania: 49 74 Uganda: 53 Thailand: 74 Zambia: 49 Vietnam: 75 [1] [1] HPV prevalence 16: 0.6%- 16: 3.3%- Mozambique 1.3% 7.7% [3] 18: 0.2%- 18:2.9%- 0.2% 6.7% Cervical cancer incidence 0.00013 – (due to HPV 16/18) 0.00063 Thailand [2] Thailand [4] 0.00025 – Tanzania [5] 0.0017 The age-dependent mortality rate for the hypothetical low and middle income countries compared to that for countries on which the data were based is shown below. Data were obtained from the 2008 figures in the World Health Organization’s Global Health Observatory Database [1]. 0.070 0.060 0.050 Mortality Model 0.040 Malawi Tanzania 0.030 Uganda 0.020 Zambia 0.010 0.000 0 20 40 60 Age 0.07 0.06 0.05 Mortality Model 0.04 Philippines Indonesia 0.03 Thailand 0.02 Vietnam 0.01 0 0 20 40 60 Age Parameters for screening in the hypothetical middle income country were obtained from a health technology assessment of cervical cancer control options in Thailand [6]. Reference List [1] World Health Organization. Global Health Observatory Database (2008 data). http://apps who int/ghodata/?vid=720# 2011 February 22 [cited 2011 Feb 22]; [2] Sukvirach S, Smith JS, Tunsakul S, Munoz N, Kesararat V, Opasatian O, et al. Population-based human papillomavirus prevalence in Lampang and Songkla, Thailand. J Infect Dis 2003 Apr 15;187(8):1246-56. [3] Castellsague X, Menendez C, Loscertales MP, Kornegay JR, dos SF, Gomez-Olive FX, et al. Human papillomavirus genotypes in rural Mozambique. Lancet 2001 Oct 27;358(9291):1429-30. [4] World Health Organization. WHO/ICO Information Centre on Human Papilloma Virus (HPV) and Cervical Cancer. World Health Organization 2010 September 12Available from: URL: http://www.who.int/hpvcentre/en/ [5] Goldie SJ, O'Shea M, Campos NG, Diaz M, Sweet S, Kim SY. Health and economic outcomes of HPV 16,18 vaccination in 72 GAVI-eligible countries. Vaccine 2008 Jul 29;26(32):4080-93. [6] Tangcharoensathien V, Limwattananon S, Chaugwon R, Praditsittikorn N, Teerawattananon Y, Tantavess S. Research for Development of an Optimal Policy Strategy for Prevention and Control of Cervical Cancer in Thailand. Research report submitted to the World Bank. Nonthaburi, Thailand: International Health Policy Program, Thailand (IHPP) and Health Intervention and Technology Assessment Program (HITAP), Ministry of Public Health, 2008.
