How to Collect Peak Flow Data from the USGS Water Data Site
advertisement
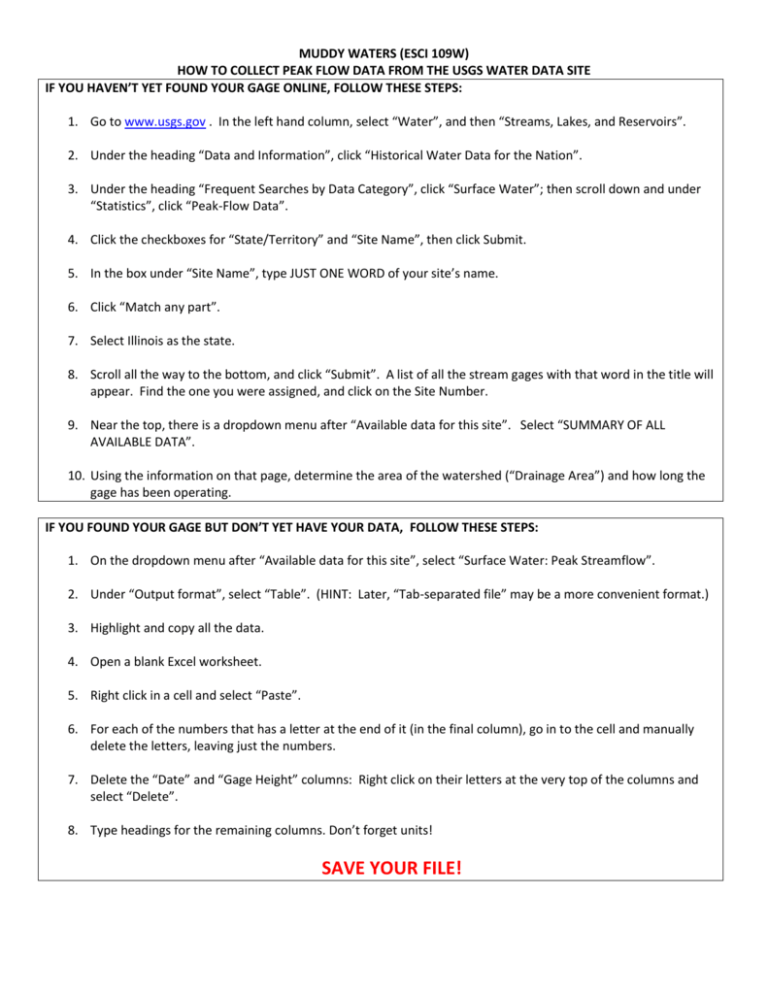
MUDDY WATERS (ESCI 109W) HOW TO COLLECT PEAK FLOW DATA FROM THE USGS WATER DATA SITE IF YOU HAVEN’T YET FOUND YOUR GAGE ONLINE, FOLLOW THESE STEPS: 1. Go to www.usgs.gov . In the left hand column, select “Water”, and then “Streams, Lakes, and Reservoirs”. 2. Under the heading “Data and Information”, click “Historical Water Data for the Nation”. 3. Under the heading “Frequent Searches by Data Category”, click “Surface Water”; then scroll down and under “Statistics”, click “Peak-Flow Data”. 4. Click the checkboxes for “State/Territory” and “Site Name”, then click Submit. 5. In the box under “Site Name”, type JUST ONE WORD of your site’s name. 6. Click “Match any part”. 7. Select Illinois as the state. 8. Scroll all the way to the bottom, and click “Submit”. A list of all the stream gages with that word in the title will appear. Find the one you were assigned, and click on the Site Number. 9. Near the top, there is a dropdown menu after “Available data for this site”. Select “SUMMARY OF ALL AVAILABLE DATA”. 10. Using the information on that page, determine the area of the watershed (“Drainage Area”) and how long the gage has been operating. IF YOU FOUND YOUR GAGE BUT DON’T YET HAVE YOUR DATA, FOLLOW THESE STEPS: 1. On the dropdown menu after “Available data for this site”, select “Surface Water: Peak Streamflow”. 2. Under “Output format”, select “Table”. (HINT: Later, “Tab-separated file” may be a more convenient format.) 3. Highlight and copy all the data. 4. Open a blank Excel worksheet. 5. Right click in a cell and select “Paste”. 6. For each of the numbers that has a letter at the end of it (in the final column), go in to the cell and manually delete the letters, leaving just the numbers. 7. Delete the “Date” and “Gage Height” columns: Right click on their letters at the very top of the columns and select “Delete”. 8. Type headings for the remaining columns. Don’t forget units! SAVE YOUR FILE! IF YOU ALREADY HAVE YOUR PEAK FLOW DATA, START HERE: You should have two columns of data: Year, and Streamflow (or Discharge). Type headings for the next few columns: Rank, and Annual Percent Probability. (HINT: Click “Wrap Text” to make it look better.) Use the mouse to highlight all the numbers in the first two columns (do not highlight the column headings!) Right click the highlighted data and select “Sort”, then “Custom Sort”. On the dropdown for “Sort by”, select the column for Streamflow (same thing as discharge). On the dropdown for “Order”, select “Largest to Smallest”. Click OK. What happens? In the “Rank” column, type the number 1 in the first line of data and the number 2 in the second line. Use the mouse to highlight the first two cells (the 1 and 2). Note the tiny square at the lower right corner of the highlighted area. Grab it with the mouse and drag it downward to the bottom of the table. What happens? Click the first cell in the Annual Percent Probability column. Type this: =Rank /(N+1). However, don’t type that exactly! Instead of “Rank”, click in the cell that shows the rank for that particular year. And instead of “N”, type the number of years of stream flow records you have. Press enter. What happens? Highlight the cell you just typed in, and look for the tiny square at the lower right-hand side of the cell. Grab it with the mouse and drag it down to the bottom of the table of data. What happens? With the whole column of Annual Percent Probability numbers highlighted, click the % sign in the menu bar at the top (it’s in the Number part of the menu). In the column after Annual Percent Probability, type the heading, “RETURN TIME (years)”. (HINT: Click “Wrap Text” to make it look better!) Click in the first cell under that heading, and type this formula: =1/probability. However, don’t type that exactly! Instead of “probability”, click in the cell that shows the probability for that particular size flow. Highlight the cell you just typed in, and look for the tiny square at the lower right-hand side of the cell. Grab it with the mouse and drag it down to the bottom of the table of data. What happens? Find the button in the “Number” area on the menu that allows you to limit the number of decimal places. Limit it to one decimal place. SAVE YOUR FILE! MAKE IT LOOK GOOD Neaten up the data and make it look nice. Adjust the alignment (centering everything sometimes looks best), font size, cell borders, colors, and so on. Make sure all your units are specified. SAVE YOUR FILE AGAIN! E-mail your file to yourself and your teammates. If you are working on an Earth Science computer, your file may not be there when you come back, so be sure you have a copy! Next, we’ll work on graphs.

