Additional file 1
advertisement
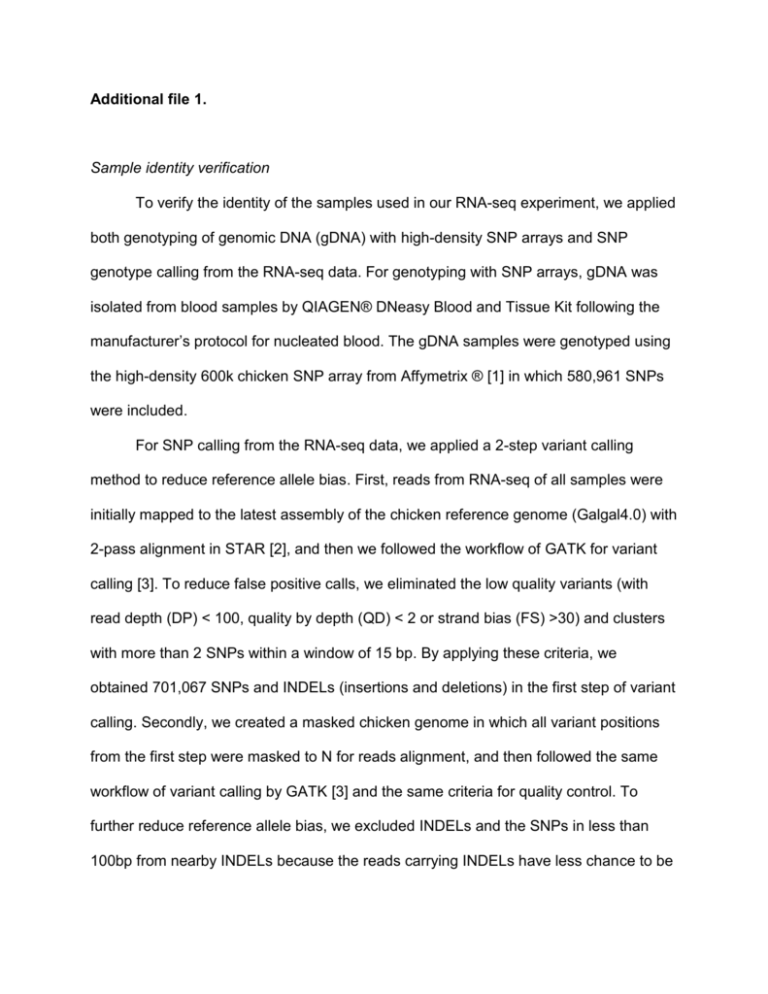
Additional file 1. Sample identity verification To verify the identity of the samples used in our RNA-seq experiment, we applied both genotyping of genomic DNA (gDNA) with high-density SNP arrays and SNP genotype calling from the RNA-seq data. For genotyping with SNP arrays, gDNA was isolated from blood samples by QIAGEN® DNeasy Blood and Tissue Kit following the manufacturer’s protocol for nucleated blood. The gDNA samples were genotyped using the high-density 600k chicken SNP array from Affymetrix ® [1] in which 580,961 SNPs were included. For SNP calling from the RNA-seq data, we applied a 2-step variant calling method to reduce reference allele bias. First, reads from RNA-seq of all samples were initially mapped to the latest assembly of the chicken reference genome (Galgal4.0) with 2-pass alignment in STAR [2], and then we followed the workflow of GATK for variant calling [3]. To reduce false positive calls, we eliminated the low quality variants (with read depth (DP) < 100, quality by depth (QD) < 2 or strand bias (FS) >30) and clusters with more than 2 SNPs within a window of 15 bp. By applying these criteria, we obtained 701,067 SNPs and INDELs (insertions and deletions) in the first step of variant calling. Secondly, we created a masked chicken genome in which all variant positions from the first step were masked to N for reads alignment, and then followed the same workflow of variant calling by GATK [3] and the same criteria for quality control. To further reduce reference allele bias, we excluded INDELs and the SNPs in less than 100bp from nearby INDELs because the reads carrying INDELs have less chance to be mapped to the reference genome [4]. After all, we obtained 201,079 SNPs on exonic regions of the chicken genome, of which 14,887 were overlapped with the SNPs from the 600k SNP array based on their physical positions. Of these overlapped SNPs, we only used homozygous loci for the identity verification of the samples used in our RNAseq experiment, as heterozygous SNPs may express in allele specific ways. For each chicken, we matched its 600k SNP genotypes of homozygous loci with those in variant calling from RNA-seq data and used the percentage of matching genotypes for the identity verification of the samples. We found the percentages of matching genotypes between SNP arrays and RNAseq from the same birds were higher than 99.2 but between different birds, the percentages ranged from 58.4% to 68.5%. This information allowed us to verify the identity of all samples used in our RNA-seq experiment (see below Table 1). Table 1. Matrix of percentages (%) of matching genotypes between 600K SNP array and RNA-seq Samples genotyped by 600k SNP chips C51 C52 C53 C55 C56 C57 C59 C62 C63 C64 C66 C51 99.4 59.7 59.5 60.0 61.4 59 58.9 59.7 60.7 60.5 60.3 C52 62.8 99.4 63.6 62.4 62.6 64.5 64.3 64.3 64.8 65.4 63.8 C53 61.0 62.1 99.4 61.2 62.9 61.5 63.5 63.6 62.8 64.0 60.9 C55 60.8 60.3 60.5 99.2 62.6 66.4 62.4 63.4 62.7 60.1 62.0 C56 64.7 63.1 64.7 64.9 99.3 62.4 65.5 65.5 63.4 62.7 65.1 C57 60.9 63.2 61.9 67.6 60.8 99.4 61.5 63.2 65.0 62.5 63.7 C59 59.3 61.5 62.2 61.9 62.5 60.1 99.4 63.6 62.6 65.1 61.2 C62 61.1 62.4 63.3 63.7 63.3 62.7 64.5 99.5 63.2 63.2 68.5 C63 60.7 61.7 61.3 61.6 59.8 63.1 62.2 61.7 99.5 62.4 60.7 C64_1 60.9 62.2 63.2 63.6 63.1 62.5 64.5 99.5 62.9 63.1 68.3 C64_2 61.7 63.4 63.5 60.4 60.8 61.8 66.0 63.1 63.7 99.5 61.7 C66 59.5 59.6 58.4 60.1 60.4 60.6 59.9 65.9 59.7 59.5 99.4 Note: *: ID from RNA-seq samples. C64_1 stands for sample C64 in our first SeqID* batch of cDNA library preparation for RNA-seq, which shows that its genotypes from RNA-seq are matched to sample C62’s genotypes on SNP array, marked red color in the table. Thus, we repeated the RNA isolation, cDNA library preparation and RNA-seq for C64 labeled as C64_2 in the table. Its percentage of matching genotypes between 600K SNP array and RNA-seq is 99.5%, marked green color in the table. Since NanoString data for this sample was obtained using C64_1 RNA sample, we excluded this sample from log2 (fold-change) estimation from Nanostring data. References: 1. Kranis A, Gheyas AA, Boschiero C, Turner F, Yu L, Smith S, Talbot R, Pirani A, Brew F, Kaiser P, Hocking PM, Fife M, Salmon N, Fulton J, Strom TM, Haberer G, Weigend S, Preisinger R, Gholami M, Qanbari S, Simianer H, Watson KA, Woolliams JA, Burt DW: Development of a high density 600K SNP genotyping array for chicken. BMC Genomics 2013, 14:59. 2. Dobin A, Davis CA, Schlesinger F, Drenkow J, Zaleski C, Jha S, Batut P, Chaisson M, Gingeras TR: STAR: ultrafast universal RNA-seq aligner. Bioinformatics 2013, 29:15–21. 3. McKenna A, Hanna M, Banks E, Sivachenko A, Cibulskis K, Kernytsky A, Garimella K, Altshuler D, Gabriel S, Daly M, DePristo MA: The Genome Analysis Toolkit: a MapReduce framework for analyzing next-generation DNA sequencing data. Genome Res 2010, 20:1297–303. 4. Stevenson KR, Coolon JD, Wittkopp PJ: Sources of bias in measures of allelespecific expression derived from RNA-sequence data aligned to a single reference genome. BMC Genomics 2013, 14:536.
