Supplementary Table 1 The predictive values for the onset of KD
advertisement
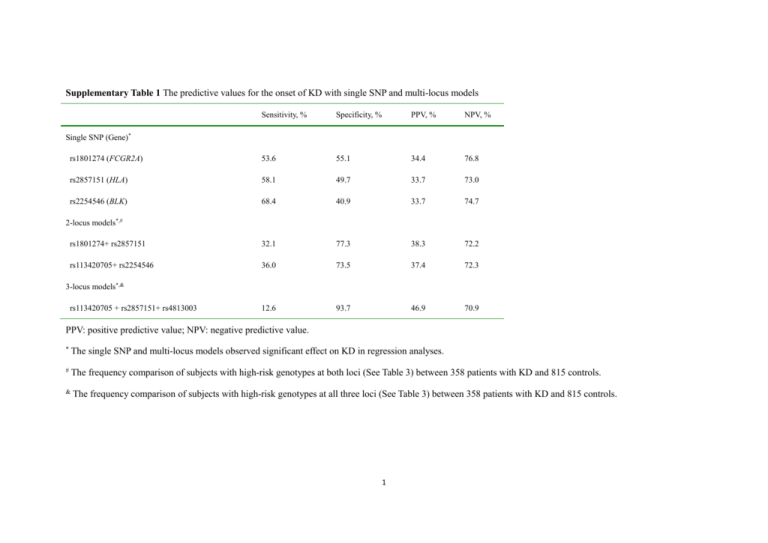
Supplementary Table 1 The predictive values for the onset of KD with single SNP and multi-locus models Sensitivity, % Specificity, % PPV, % NPV, % rs1801274 (FCGR2A) 53.6 55.1 34.4 76.8 rs2857151 (HLA) 58.1 49.7 33.7 73.0 rs2254546 (BLK) 68.4 40.9 33.7 74.7 rs1801274+ rs2857151 32.1 77.3 38.3 72.2 rs113420705+ rs2254546 36.0 73.5 37.4 72.3 12.6 93.7 46.9 70.9 Single SNP (Gene)* 2-locus models*,# 3-locus models*,& rs113420705 + rs2857151+ rs4813003 PPV: positive predictive value; NPV: negative predictive value. * The single SNP and multi-locus models observed significant effect on KD in regression analyses. # The frequency comparison of subjects with high-risk genotypes at both loci (See Table 3) between 358 patients with KD and 815 controls. & The frequency comparison of subjects with high-risk genotypes at all three loci (See Table 3) between 358 patients with KD and 815 controls. 1 Supplementary Table 2 Conditional multi-variable logistic regression analyses for the associations of the SNPs with CALs SNP (Gene) Allele Genotype High-risk Low-risk OR (95% CI) P valuea (α’ = 0.007) rs1801274 (FCGR2A) A/G AA AG/GG 1.915 (0.986,3.722) 0.055 rs113420705 (CASP3) G/A AA/AG GG 1.574 (0.809,3.063) 0.182 rs2857151 (HLA) A/G GG AG/AA 1.702 (0.823,3.520) 0.152 rs2254546 (BLK) A/G GG AG/AA 1.343 (0.706,2.555) 0.368 rs4813003 (CD40) C/T CC CT/TT 1.408 (0.740,2.680) 0.297 The risk alleles were underlined. a Multiple regression analysis in 46 KD patients with CALs and 312 KD patients without CALs. The P values were adjusted for gender and age. The significant level was corrected with the formula of α’ = α/5 = 0.01 (5 tests, 5 variables × 1 test/variable) according to the Bonferroni method. 2 Supplementary Table 3 Conditional multi-variable logistic regression analyses for the associations of the SNPs with IVIG unresponsiveness SNP (Gene) Allele Genotype High-risk Low-risk OR (95% CI) P valuea (α’ = 0.007) rs1801274 (FCGR2A) A/G AA AG/GG 1.232 (0.666,2.280) 0.506 rs113420705 (CASP3) G/A AA/AG GG 1.083 (0.583,2.012) 0.802 rs2857151 (HLA) A/G GG AG/AA 1.340 (0.675,2.657) 0.403 rs2254546 (BLK) A/G GG AG/AA 1.051 (0.568,1.946) 0.874 rs4813003 (CD40) C/T CC CT/TT 1.052 (0.574,1.926) 0.870 The risk alleles were underlined. a Multiple regression analysis in 51 KD patients with IVIG unresponsiveness and 307 KD patients without IVIG unresponsiveness. The P values were adjusted for gender and age. The significant level was corrected with the formula of α’ = α/5 = 0.01 (5 tests, 5 variables × 1 test/variable) according to the Bonferroni method. 3 Supplementary Table 4 Association of the SNPs with general characteristics in patients with KD High risk groupa (n) Low risk groupb (n) P valuec rs1801274* 1.57 ± 1.86 (192) 1.63 ± 1.93 (166) 0.765 rs2857151* 1.62 ± 1.80 (208) 1.57 ± 1.96 (150) 0.803 rs2254546* 1.53 ± 1.78 (245) 1.72 ± 2.01 (113) 0.369 Male (%) 73 (63.5) 149 (61.3) 0.694 Female (%) 42 (36.5) 94 (38.7) Male (%) 84 (65.1) 138 (60.3) Female (%) 45 (34.9) 91 (39.7) Male (%) 29 (64.4) 193(61.7) Female (%) 16 (35.6) 120 (38.3) General characteristics Age at onset (years, mean ± SD) Gender rs1801274+ rs2857151* rs113420705+ rs2254546* 0.364 rs113420705 + rs2857151+ rs4813003* a Subjects with high-risk genotypes shown in Table 3 at all loci. 4 0.719 b Subjects with low-risk genotype shown in Table 3 at any locus. c Student’s t test for the comparison of age at onset, the significant level was corrected with the formula of α’ = α/3 = 0.017 (3 tests, 3 SNPs × 1 test/SNP) according to the Bonferroni method. Chi-Squared test for the comparison of gender, the significant level was corrected with the formula of α’ = α/3 = 0.017 (3 tests, 3 multi-locus models × 1 test/ multi-locus models) according to the Bonferroni method. * The single SNP and multi-locus models observed significant effect on Kawasaki disease in regression analyses. 5

