Confidence Intervals for Proportions
If one has a relatively large sample (large enough to use a normal approximation of the
binomial parameter p), then one can construct a confidence interval about one’s estimate of the
pq
population proportion by using the following formula: pˆ Z 2
. For example, suppose we wish
n
to estimate the proportion of persons who would vote for a guilty verdict in a particular sexual
harassment case. We shall use the data from a study by Egbert, Moore, Wuensch, and Castellow
(1992, Journal of Social Behavior and Personality, 7: 569-579). Of 160 mock jurors of both sexes,
105 voted guilty and 55 voted not guilty. Our point estimate of the population proportion is simply our
sample proportion, 105 / 160 = .656. Is n large enough (given p and q) to use our normal
approximation, that is, is np 2 npq (which is essentially a 95% confidence interval for the number
of successes) within 0 n ? If we construct a 95% confidence interval for p and the interval is within
01, then the normal approximation is OK. For a 95% confidence interval we compute:
.656(.344)
.656 1.96
.656 .074 .582 .730 .
160
Suppose we look at the proportions separately for female and male jurors. Among the 80
female jurors 58 (72.5%) voted guilty. For a 95% confidence interval we compute:
.725(.275)
.725 1.96
.725 .098 .627 .823 .
80
Among the 80 male jurors 47 (58.8%) voted guilty. For a 95% confidence interval we compute:
.588(.412)
.588 1.96
.588 .108 .480 .696 . Do notice that the confidence interval for the
80
male jurors overlaps the confidence interval for the female jurors.
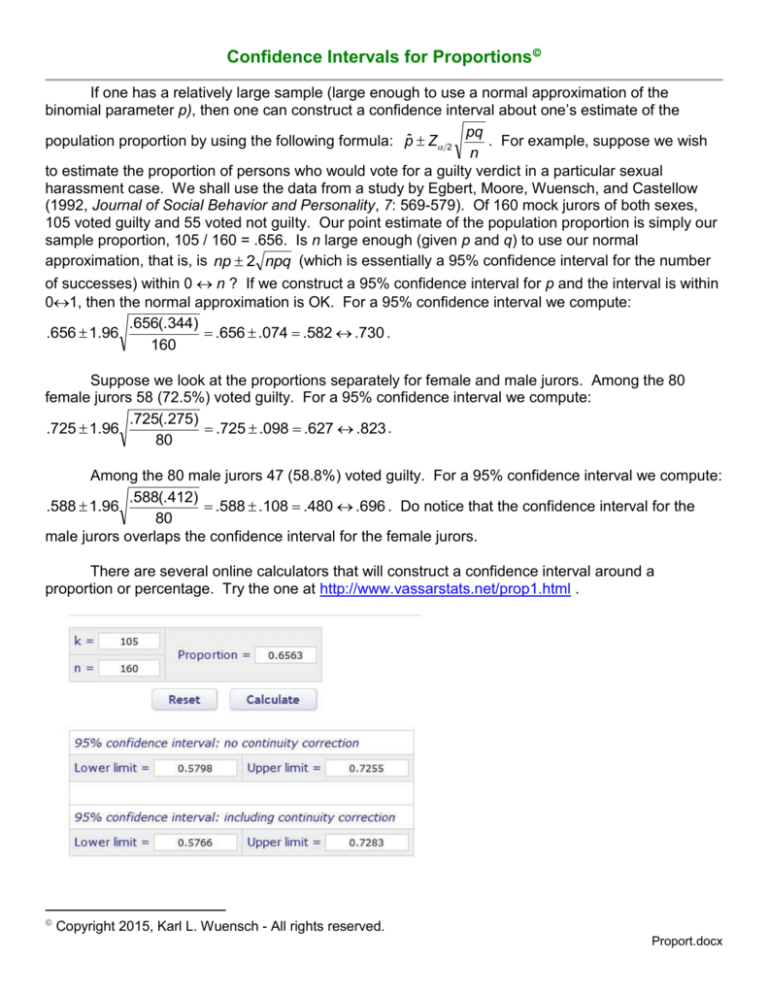
There are several online calculators that will construct a confidence interval around a
proportion or percentage. Try the one at http://www.vassarstats.net/prop1.html .
Copyright 2015, Karl L. Wuensch - All rights reserved.
Proport.docx
If you prefer a Bayesian approach, try the calculator at
http://www.causascientia.org/math_stat/ProportionCI.html .
For the first confidence interval we constructed using the normal approximation, the proportion
= 105 / 160 = .656. Using this calculator to obtain an exact confidence interval,
Difference Between Two Proportions From Independent Samples
We might want to construct a confidence interval for the difference between the two
pq p q
proportions. The appropriate formula is pˆ1 pˆ 2 Z 2 1 1 2 2 . For our data, a 95% confidence
n1
n2
interval is .725 .588 1.96
.725(.275) .588(.412)
.137 .146 .009 .283 . Notice that this
80
80
confidence interval includes the value of zero. I have written a SPSS macro that will compute such
confidence intervals. If you wish to try it, download CI_p1-p2.zip from my SPSS Programs Page. It is
most useful when computing several such confidence intervals.
VassarStats has an easy to use online calculator for obtaining a confidence interval for the
difference between independent samples. For example, subjects were asked to select whether to
complete a survey about dogs or about cats. Then they were asked to list all of the aspects that
came to mind when thinking about this animal.
Among the 1,020 persons thinking about dogs, 122 said that they thought about physical activity
(going on walks, exercise, etc.), while 0 of 626 persons reporting what cats made them think of gave
the same response. For a confidence interval for the differences between these two proportions,
Notice that the confidence interval excludes the value zero. Accordingly, the difference
between proportions is statistically significant.
Frequently Asked Questions
Monte Carlo for Proportions
Copyright 2015, Karl L. Wuensch - All rights reserved.


