Confidence Intervals for Proportions
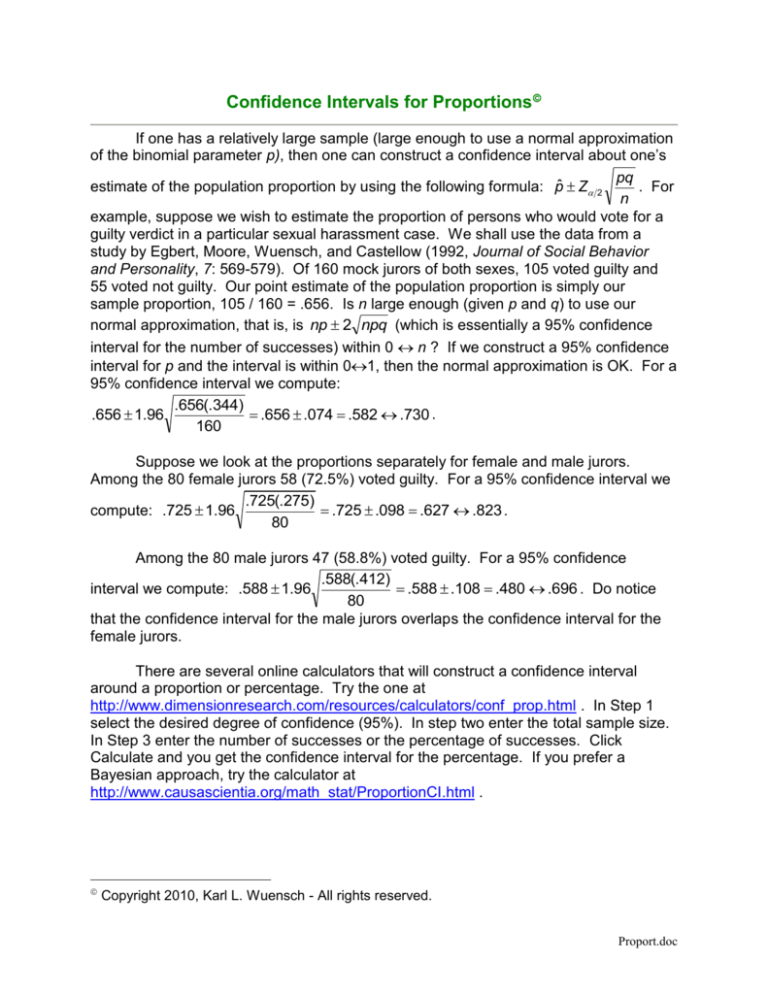
If one has a relatively large sample (large enough to use a normal approximation
of the binomial parameter p), then one can construct a confidence interval about one’s
pq
estimate of the population proportion by using the following formula: pˆ Z 2
. For
n
example, suppose we wish to estimate the proportion of persons who would vote for a
guilty verdict in a particular sexual harassment case. We shall use the data from a
study by Egbert, Moore, Wuensch, and Castellow (1992, Journal of Social Behavior
and Personality, 7: 569-579). Of 160 mock jurors of both sexes, 105 voted guilty and
55 voted not guilty. Our point estimate of the population proportion is simply our
sample proportion, 105 / 160 = .656. Is n large enough (given p and q) to use our
normal approximation, that is, is np 2 npq (which is essentially a 95% confidence
interval for the number of successes) within 0 n ? If we construct a 95% confidence
interval for p and the interval is within 01, then the normal approximation is OK. For a
95% confidence interval we compute:
.656(.344)
.656 1.96
.656 .074 .582 .730 .
160
Suppose we look at the proportions separately for female and male jurors.
Among the 80 female jurors 58 (72.5%) voted guilty. For a 95% confidence interval we
.725(.275)
compute: .725 1.96
.725 .098 .627 .823 .
80
Among the 80 male jurors 47 (58.8%) voted guilty. For a 95% confidence
.588(.412)
interval we compute: .588 1.96
.588 .108 .480 .696 . Do notice
80
that the confidence interval for the male jurors overlaps the confidence interval for the
female jurors.
There are several online calculators that will construct a confidence interval
around a proportion or percentage. Try the one at
http://www.dimensionresearch.com/resources/calculators/conf_prop.html . In Step 1
select the desired degree of confidence (95%). In step two enter the total sample size.
In Step 3 enter the number of successes or the percentage of successes. Click
Calculate and you get the confidence interval for the percentage. If you prefer a
Bayesian approach, try the calculator at
http://www.causascientia.org/math_stat/ProportionCI.html .
Copyright 2010, Karl L. Wuensch - All rights reserved.
Proport.doc
Difference Between Two Proportions From Independent Samples
We might want to construct a confidence interval for the difference between the
pq p q
two proportions. The appropriate formula is pˆ1 pˆ 2 Z 2 1 1 2 2 . For our data,
n1
n2
a 95% confidence interval is
.725 .588 1.96 .725(.275) .588(.412) .137 .146 .009 .283 . Notice that
80
80
this confidence interval includes the value of zero. I have written an PASW macro that
will compute such confidence intervals. If you wish to try it, download CI_p1-p2.zip
from my PASW/SPSS Programs Page. It is most useful when computing several such
confidence intervals.
Frequently Asked Questions
Copyright 2010, Karl L. Wuensch - All rights reserved.


