ece3873-sup-0003-TableS1
advertisement
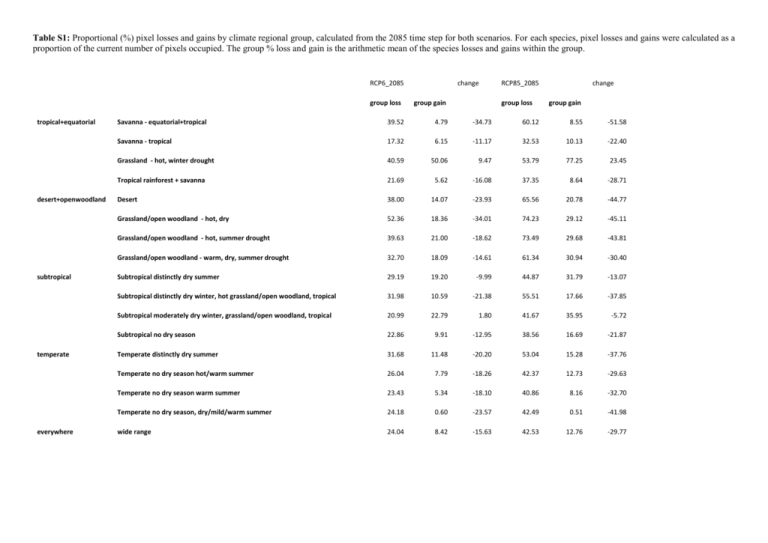
Table S1: Proportional (%) pixel losses and gains by climate regional group, calculated from the 2085 time step for both scenarios. For each species, pixel losses and gains were calculated as a proportion of the current number of pixels occupied. The group % loss and gain is the arithmetic mean of the species losses and gains within the group. RCP6_2085 group loss tropical+equatorial desert+openwoodland subtropical temperate everywhere change group gain RCP85_2085 group loss change group gain Savanna - equatorial+tropical 39.52 4.79 -34.73 60.12 8.55 -51.58 Savanna - tropical 17.32 6.15 -11.17 32.53 10.13 -22.40 Grassland - hot, winter drought 40.59 50.06 9.47 53.79 77.25 23.45 Tropical rainforest + savanna 21.69 5.62 -16.08 37.35 8.64 -28.71 Desert 38.00 14.07 -23.93 65.56 20.78 -44.77 Grassland/open woodland - hot, dry 52.36 18.36 -34.01 74.23 29.12 -45.11 Grassland/open woodland - hot, summer drought 39.63 21.00 -18.62 73.49 29.68 -43.81 Grassland/open woodland - warm, dry, summer drought 32.70 18.09 -14.61 61.34 30.94 -30.40 Subtropical distinctly dry summer 29.19 19.20 -9.99 44.87 31.79 -13.07 Subtropical distinctly dry winter, hot grassland/open woodland, tropical 31.98 10.59 -21.38 55.51 17.66 -37.85 Subtropical moderately dry winter, grassland/open woodland, tropical 20.99 22.79 1.80 41.67 35.95 -5.72 Subtropical no dry season 22.86 9.91 -12.95 38.56 16.69 -21.87 Temperate distinctly dry summer 31.68 11.48 -20.20 53.04 15.28 -37.76 Temperate no dry season hot/warm summer 26.04 7.79 -18.26 42.37 12.73 -29.63 Temperate no dry season warm summer 23.43 5.34 -18.10 40.86 8.16 -32.70 Temperate no dry season, dry/mild/warm summer 24.18 0.60 -23.57 42.49 0.51 -41.98 wide range 24.04 8.42 -15.63 42.53 12.76 -29.77
