Name: . D.3 Test When a certain rock formed, it contained 12 mg of
advertisement
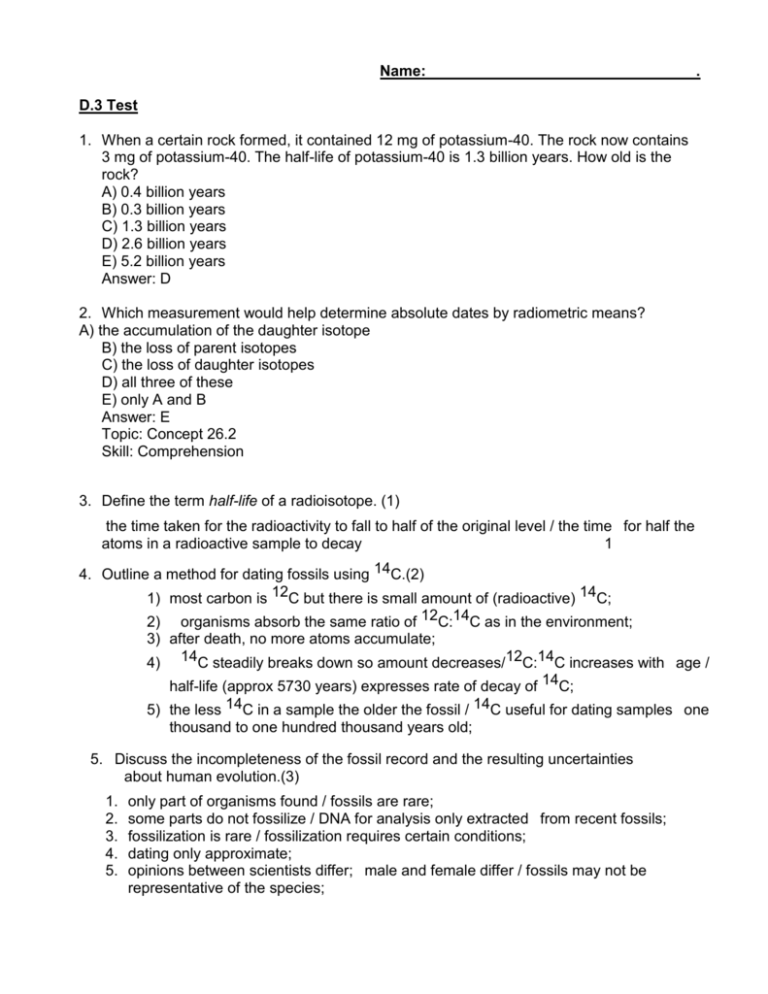
Name: . D.3 Test 1. When a certain rock formed, it contained 12 mg of potassium-40. The rock now contains 3 mg of potassium-40. The half-life of potassium-40 is 1.3 billion years. How old is the rock? A) 0.4 billion years B) 0.3 billion years C) 1.3 billion years D) 2.6 billion years E) 5.2 billion years Answer: D 2. Which measurement would help determine absolute dates by radiometric means? A) the accumulation of the daughter isotope B) the loss of parent isotopes C) the loss of daughter isotopes D) all three of these E) only A and B Answer: E Topic: Concept 26.2 Skill: Comprehension 3. Define the term half-life of a radioisotope. (1) the time taken for the radioactivity to fall to half of the original level / the time for half the atoms in a radioactive sample to decay 1 4. Outline a method for dating fossils using 14C.(2) 1) most carbon is 12C but there is small amount of (radioactive) 14C; 2) organisms absorb the same ratio of 12C:14C as in the environment; 3) after death, no more atoms accumulate; 4) 14C steadily breaks down so amount decreases/12C:14C increases with age / half-life (approx 5730 years) expresses rate of decay of 14C; 5) the less 14C in a sample the older the fossil / 14C useful for dating samples one thousand to one hundred thousand years old; 5. Discuss the incompleteness of the fossil record and the resulting uncertainties about human evolution.(3) 1. 2. 3. 4. 5. only part of organisms found / fossils are rare; some parts do not fossilize / DNA for analysis only extracted from recent fossils; fossilization is rare / fossilization requires certain conditions; dating only approximate; opinions between scientists differ; male and female differ / fossils may not be representative of the species; 6. rarity of fossils lead to missing links in the fossil record; 7. quoting of accepted dates; naming of one or more species (accept Genus only or anglicized name, but not "Lucy"); 8. many aspects of human evolution (eg language) are not represented in fossil record; (b) The half-life of the radioisotope 14C is approximately 5730 years (2) Using the decay curve shown above, deduce the age of a fossil that contains 30% of the original amount of 14C. (1) (b) 10000 years 6. Describe two major trends that can be seen from fossil remains in the sequence Ardipithecus ramidus, Australopithecus species and Homo species.(2) 1) increased bipedalism; increased brain size/cranial capacity; reduction of sagittal crest; 2) tooth size reduction; 3) flattening of the facial bones; 4) development of opposable thumb; 2 max 7. State one difference between cultural evolution and genetic evolution.(1) 1) cultural evolution involves passing of technology/language/customs from one generation to the next / does not affect the gene pool/change the genetic makeup while genetic evolution involves passing of genes/genetic mutations from one generation to another / OWTTE; 2) cultural evolution allows for faster changes than genetic evolution; 3) Accept any other valid difference. (1) 8. Discuss how cultural evolution in humans depended on increases in brain size. (3) 1) large brain size correlates with language; 2) large brain correlates with improvements in tool-making; 3) improved tools allow more nutritious diets for further brain development; 4) increased brain size leads to rituals / burying the dead; 5) excellent eye-hand coordination; 6) increased brain size leads to written history / cave art / symbolic thought; 9. Describe two major anatomical features of humans that define them as primates.(2) 1) opposable thumb; 2) large range of shoulder movement; 3) good vision / stereoscopic vision / overlapping field view; 4) large brain relative to body size; tailless primate; 5) Y-5 cusps of molars; 10. Discuss the correlation between change in the diet and increase in brain size in early hominid evolution. (5) 1) tool making first associated with H. habilis; 2) requires larger brain; 3) brain requires vast amounts of energy / consumes 40% of energy intake; 4) so larger brain size had an effect on diet requirements / created a demand for changes in diet; 5) food scarcity may lead to decrease in brain size; 6) change to higher calorific diet may allow increase in brain size; 7) more complex tool making / human society / language development required larger brain size; 8) larger brain / better cognitive skills allowed for better hunting and gathering; 9) led to greater calorific intake; 10) about 2.5 MYBP (million years before present) animal foods began to occupy an increasingly prominent place in diet; 11) animal tissues can provide the necessary structural lipid for human brain expansion; 12) changes in the dental fossil record are indirect evidence for such a change in diet; 11. Modern day primates are thought to have evolved from shrews and insectivores. Measurements of the brains of various species from which primates evolved show that the percentage of the brain that is cortex, differs between species. The graph shows this data for four different groups of species. Reprinted with permission from Macmillan Publishers Ltd: Damon A. Clark et al, “Scalable architecture in mammalian brains”, Nature, 411 (6834) pp. 189-193, © 2001 (a) A species has a brain volume 1 000 mm–3 of which 18% is cortex. State which group it is likely to belong to. ....................................................................................................................................(1) (b) State the lowest percentage of brain cortex among the shrews studied. ....................................................................................................................................(1) (c) Using the graph, compare insectivores with lemurs. .................................................................................................................................... .................................................................................................................................... .................................................................................................................................... .................................................................................................................................... ....................................................................................................................................(2) (d) (i) Using the letter H, label the graph to show which point represents Homo sapiens. (1) (ii) Explain the reasons for your choice in (i). .......................................................................................................................... ..........................................................................................................................(1) (Total 6 marks) 16. (a) insectivore 1 (b) 30% 1 (c) all lemurs have a greater percentage of cortex than insectivores / numerical comparison; most lemurs have a greater brain volume / numerical comparison; (do not accept all) the data shows more insectivores than lemurs; 2 max For numerical comparison, as the candidate is not required to read log graphs, accept brain volume for insectivores from 100 to between 1000 and 10000 and for lemurs from between 1000 and 10000 to 10000 and 100000 eg “insectivores have a brain volume ranging from 100 to almost 10000 whereas lemurs have a brain volume of 2000 to 60000 is worth [1]. (d) (i) data point in the top right of the graph labelled 1 (ii) largest brain volume and largest cortex percentage 1 [6]
