Supplementary Fig. 1 and Supplementary Table 1
advertisement
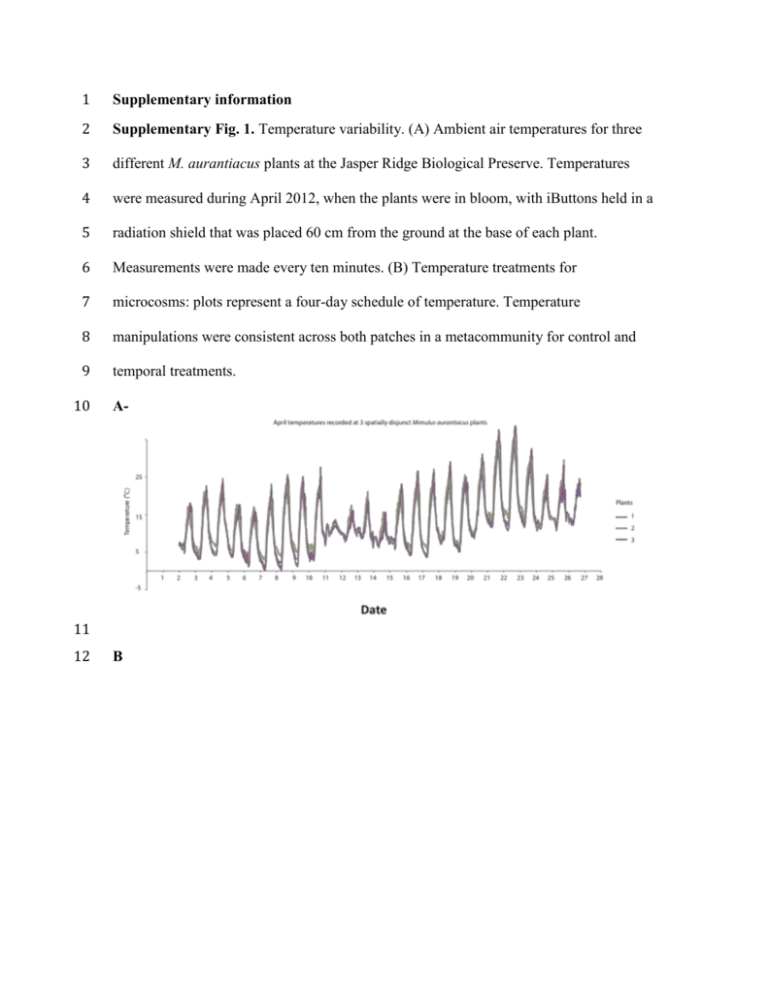
1 Supplementary information 2 Supplementary Fig. 1. Temperature variability. (A) Ambient air temperatures for three 3 different M. aurantiacus plants at the Jasper Ridge Biological Preserve. Temperatures 4 were measured during April 2012, when the plants were in bloom, with iButtons held in a 5 radiation shield that was placed 60 cm from the ground at the base of each plant. 6 Measurements were made every ten minutes. (B) Temperature treatments for 7 microcosms: plots represent a four-day schedule of temperature. Temperature 8 manipulations were consistent across both patches in a metacommunity for control and 9 temporal treatments. 10 A- 11 12 B 13 14 15 16 17 Supplementary Table 1. Variation in mean, minimum, maximum and variance in April 18 ambient air temperatures 10 different M. aurantiacus plants at the Jasper Ridge 19 Biological Preserve, showing the variation in temperatures experienced by spatially 20 disjunct individuals. Individual 1 2 3 4 5 6 7 8 9 10 12.36 13.50 13.37 13.00 12.16 13.21 12.45 13.08 13.48 12.53 Min 1.09 2.55 3.04 0.08 0.56 1.52 2.57 2.06 0.07 0.51 Max 34.14 35.60 36.05 38.64 33.09 36.05 32.11 34.11 38.10 33.54 Variance 40.29 42.22 41.91 50.80 34.38 32.85 32.94 42.02 54.02 42.93 Mean 21
