04. Operational excellence capability
advertisement
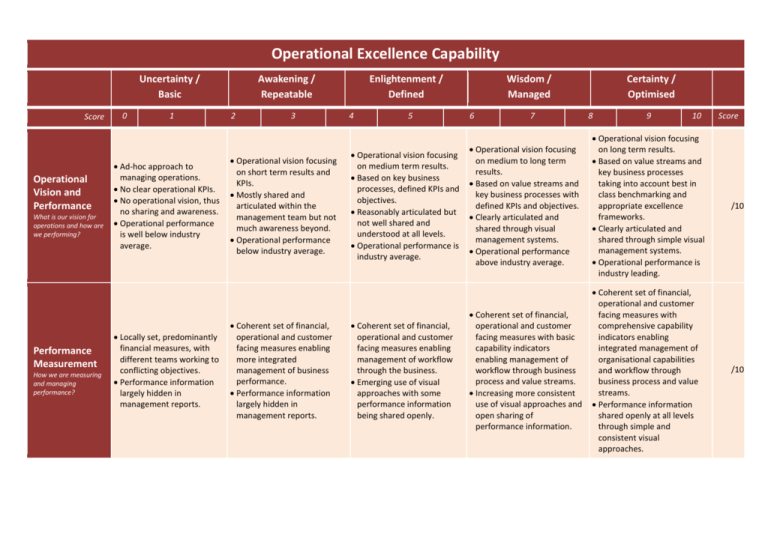
Operational Excellence Capability Uncertainty / Basic Score Operational Vision and Performance What is our vision for operations and how are we performing? Performance Measurement How we are measuring and managing performance? 0 1 Ad-hoc approach to managing operations. No clear operational KPIs. No operational vision, thus no sharing and awareness. Operational performance is well below industry average. Locally set, predominantly financial measures, with different teams working to conflicting objectives. Performance information largely hidden in management reports. Awakening / Repeatable 2 3 Operational vision focusing on short term results and KPIs. Mostly shared and articulated within the management team but not much awareness beyond. Operational performance below industry average. Coherent set of financial, operational and customer facing measures enabling more integrated management of business performance. Performance information largely hidden in management reports. Enlightenment / Defined 4 5 Operational vision focusing on medium term results. Based on key business processes, defined KPIs and objectives. Reasonably articulated but not well shared and understood at all levels. Operational performance is industry average. Coherent set of financial, operational and customer facing measures enabling management of workflow through the business. Emerging use of visual approaches with some performance information being shared openly. Wisdom / Managed 6 7 Certainty / Optimised 8 9 10 Score Operational vision focusing on medium to long term results. Based on value streams and key business processes with defined KPIs and objectives. Clearly articulated and shared through visual management systems. Operational performance above industry average. Operational vision focusing on long term results. Based on value streams and key business processes taking into account best in class benchmarking and appropriate excellence frameworks. Clearly articulated and shared through simple visual management systems. Operational performance is industry leading. /10 Coherent set of financial, operational and customer facing measures with basic capability indicators enabling management of workflow through business process and value streams. Increasing more consistent use of visual approaches and open sharing of performance information. Coherent set of financial, operational and customer facing measures with comprehensive capability indicators enabling integrated management of organisational capabilities and workflow through business process and value streams. Performance information shared openly at all levels through simple and consistent visual approaches. /10 People and teams How are our people and teams working? Business Process Improvement How good are we in continuously improving our business processes? Teams mostly functionally oriented and unaware of process and performance standards. People and team development ad-hoc at best. Random firefighting appears to be the norm. Not recognised or managed. No formal improvement programmes. No quality systems or tools being used. Cross-functional teams starting to emerge with increasing awareness of process and performance standards. Teams have defined roles with structure, discipline and accountability. Development needs of key people recognised and invested in. Flexible workforce organised in autonomous crossfunctional teams working to defined standards. Key processes owned with awareness of performance standards. Continuous improvement being managed through projects. Increasing importance of people and team development. All processes managed and Some KPIs exist around key key processes systematically processes. improved. Short interval control Standardised tool box and practices starting to emerge. common language for Some basic quality and lean process improvement management tools being starting to emerge. used; e.g., process mapping, Use of advanced quality and root cause analysis, Pareto lean management tools analysis and histograms. emerging; e.g., statistical Some visual management process control; process approaches starting to FMEA, 5S, and design of emerge. experiments. Industry standard quality Quality assurance systems assurance systems and and certifications at least on certification in place. par with industry average. Flexible workforce organised in autonomous teams working to defined policies. Key processes owned with high levels of awareness of competitive performance standards at most levels. Continuous improvement becoming habitual. Skills gaps regularly reviewed and necessary investments made. Flexible workforce organised in autonomous teams working to defined policies. All processes owned with high levels of awareness of world class performance standards at all levels. Habitual continuous improvement is the norm. Skills continuously reviewed and developed. Apprenticeship programmes and training academies in collaboration with education providers are in place. /10 All processes managed and key processes systematically improved. Standardised tool box and a common language for process improvement. Advanced quality and lean management tools commonly used. Quality assurance systems and certifications well ahead of industry average. Standardised tool box and common language for process improvement. All business processes habitually and continuously improved through systematic and habitual use of advanced quality and lean management tools. Typically four large kaizen and 12 mini kaizen projects per annum. Additionally, several small continuous improvements to all processes on a monthly basis. Industry leading quality assurance systems and certifications in place. /10 Sales and Operations Planning How do we plan our business? Supply Chain Management How do we manage our supply chain? Demand forecasts and supply plans updated annually with budgets. Little operational planning, mostly reactive. Low confidence in business plans. Sales, operations and business plans fully integrated. Forecasts developed with Sales, operations and Planning is a critical lever sales and operations input business plans fully that engages strategic and reconciled with business integrated with inputs from partners in a planning objectives. key customers. dialogue on a regular basis. Forecasts aggregated across Forecasts aggregated across Forecasts captured directly the organisation using the organisation using from customers, and historical information to historical information to expressed in standard improve the process. improve the process. terms. Progress monitored through Progress monitored through Benchmarks and service regular reviews. regular reviews. levels used to set and Confidence in business plans Moderate levels of regularly review target starting to emerge. confidence in business plans. performance levels. High levels of confidence in business plans. Planning systems and processes integrated to support the company business model. Demand forecast information: captured in terms of volume and value; flows freely between customers and suppliers enabled by common data definitions. Planning calendars ensure routine and timely communication between all levels, including customers and suppliers. High levels of confidence in business plans. /10 Supply chain management limited to purchasing and logistics. Decentralised with poor visibility across the business. Add hoc and sporadic use of suppliers with most supply chain decisions being driven by local KPIs. Supply chain strategy separate but complementary to business strategy. Supply chain processes Supply chain processes (e.g., defined and on par with plan, source, make, deliver) industry average. defined at basic level. Management attention Foundations of commodity gradually moving from and supplier management in functions to supply chain place. processes. Foundations of customer Some strategic relationships management emerging. in place with key suppliers. Basic supply chain planning Outsourcing strategies being and management practices used to overcome key starting to emerge. weaknesses. Supply chain decisions being made based on Total Cost of Ownership. Integrated supply chain and business strategy from customers’ customers to suppliers’ suppliers. Supply chain purposefully designed with long term partnership agreements with all strategic suppliers and customers. Collaborative crossenterprise teams managing and continuously improving supply chain processes. Industry leading supply chain processes and performance. Outsourcing and supply chain decisions made to maximise business performance. /10 Integrated supply chain and business strategy. Supply chain processes defined and ahead of industry average. Management attention focused on supply chain processes (not functions). Supply chain purposefully designed with long term partnership agreements with most strategic suppliers and customers. Strategic use of outsourcing. Supply chain decisions being made to maximise business performance. Operational Equipment and Systems How good are our equipment and systems? Information Systems How good are our information systems? Old unreliable and inefficient equipment with unknown capability levels. Reactive approaches to maintenance. Products/services not modularised, adversely affecting operational performance. Front line management team (i.e., supervisors/ team leaders) deal with equipment and systems problems as they arise. Fragmented information systems with multiple sources of data. Poor record and data accuracy. Little confidence in information systems. Capability levels of key equipment known and managed. Basic maintenance programme in place. The need for modularised products/services recognised and plans in place for improvement. Technical team supports front line operational teams to keep processes under control. Technical team assists in problem solving activities. Capability levels of key equipment improved through a systematic programme of maintenance and investment. Progress being made towards modularising products/services to maximise operational efficiencies. Operational teams mostly self-sufficient in keeping processes under control. Dedicated technical team focuses on maximising equipment performance whilst supporting operational teams. Fragmented information systems but with appropriate checks to ensure data accuracy and minimise duplication. Accuracy of critical data acceptable and improving. Nurturing confidence in basic data. Integrated information systems covering order fulfilment and financial transactions. Systems in other areas are standalone but integrated through manual checks. Some use of workflows emerging. Key records and data getting close to 95% accuracy levels. Growing confidence in data and information systems. Capability levels of key equipment ahead of industry average. Use of predictive maintenance programmes emerging. Modular products/services with standardised components aid operational efficiencies. Operational teams selfsufficient in keeping processes under control. Dedicated technical team focuses on maximising equipment availability and performance. Operational equipment and systems provide industry leading capability (availability, speed, quality, reliability and flexibility). Predictive maintenance programmes in place. Modular products/services maximise operational efficiencies. Operational teams experts in keeping processes under control. Dedicated technical team maximises equipment performance as well as developing new equipment/ methods that differentiate the business. /10 Integrated information systems covering most key business areas. Few stand-alone systems remain with plans for their integration. Increasing use of workflows to support business processes. Key records and data within 95% accuracy levels. High levels of confidence in information systems. End-to-end integrated information systems covering all aspects of the business (planning, financial, supply chain, operations, maintenance, product HRM and business intelligence). Workflows support all key business processes. All records and data accuracy consistently above 99% and 95% respectively. Information systems considered fundamental to daily functioning of the business. /10 Total Score /80 Total Score % Please divide your total score above by 80 and multiply by 100


