Constant Velocity Lab
advertisement
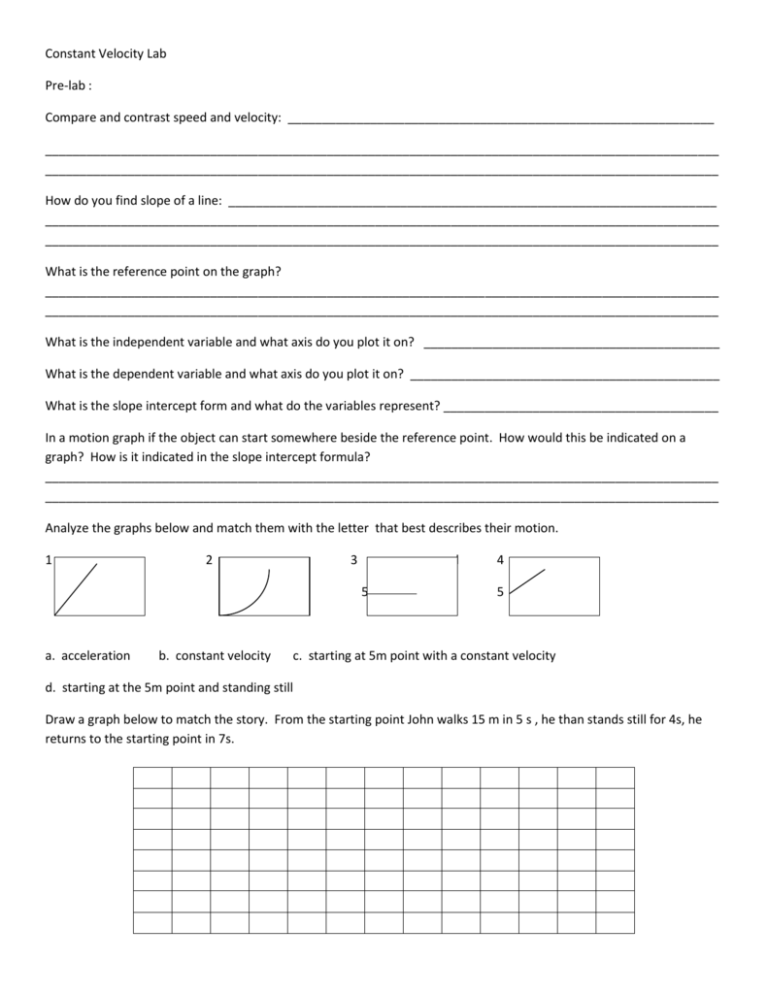
Constant Velocity Lab Pre-lab : Compare and contrast speed and velocity: ______________________________________________________________ __________________________________________________________________________________________________ __________________________________________________________________________________________________ How do you find slope of a line: _______________________________________________________________________ __________________________________________________________________________________________________ __________________________________________________________________________________________________ What is the reference point on the graph? __________________________________________________________________________________________________ __________________________________________________________________________________________________ What is the independent variable and what axis do you plot it on? ___________________________________________ What is the dependent variable and what axis do you plot it on? _____________________________________________ What is the slope intercept form and what do the variables represent? ________________________________________ In a motion graph if the object can start somewhere beside the reference point. How would this be indicated on a graph? How is it indicated in the slope intercept formula? __________________________________________________________________________________________________ __________________________________________________________________________________________________ Analyze the graphs below and match them with the letter that best describes their motion. 1 2 3 d 5 a. acceleration b. constant velocity 4 5 c. starting at 5m point with a constant velocity d. starting at the 5m point and standing still Draw a graph below to match the story. From the starting point John walks 15 m in 5 s , he than stands still for 4s, he returns to the starting point in 7s. Lab Purpose: To graph motion of a constant velocity vehicle and analyze the graph to determine velocity. Equipment: Constant velocity vehicle chalk Meter stick Stop Watch Procedure: 1. Mark a beginning spot on the pavement or gym floor. 2. One student keeps time while another marks the progress of the vehicle on the ground. At a fixed time interval (we will use 2 or 5 seconds) the timer will yell mark and the marker will mark the spot the vehicle is at. We will do this for 30 seconds. 3. Then the students will measure the distance from the beginning mark and the next mark. That is the distance the vehicle traveled in 5 (or 2) seconds. Measure and record the distance between each mark for each time interval. 4. Create a graph of the information. Using the graph determine the speed of the vehicle. Data: Time (s) 0s Distance (m) between marks 0m Total Distance (m) 0m Graph Data: Total Distance vs. time Analysis: (show any equations worked) Conclusion: __________________________________________________________________________________________________ __________________________________________________________________________________________________ __________________________________________________________________________________________________ __________________________________________________________________________________________________ __________________________________________________________________________________________________ __________________________________________________________________________________________________ Post Lab: 1. What is your independent variable?___________________________________ What axis do you graph it on? ____________________________ 2. What is your dependent variable?_____________________________________ What axis do you graph it on? 3. Was the speed of your vehicle constant? ___________ How can you tell? _____________________ 4. If the speed was not constant, what factors would have caused this? __________________________ 5. What could be possible causes of experimenter error? _____________________________________ 6. Draw a best fit line. 7. Use the slope formula to determine the slope of your line. __________________________________ 8. What is the speed of your vehicle? ______________________________________________________ 9. Write an equation for the graph in slope intercept form. _______________________________ 10. If the car had started at the 2 meter mark instead of the zero what would your formula be? _____________ Homework : Work the following problems and be prepared to discuss them next class period. 1. A woman counts her steps as she walks. In 28 s she walks a total distance of 35 m. What is the average distance of each step? ____________________ Using the slope formula (show work) what is her velocity? ___________________ What is the dependent variable? ____________________ What is the independent variable? ___________________ Write an equation for the table in slope intercept form. ____________________________ steps 10 Time (s) 2 25 5 45 8 70 13 2. A car starts at the 5 m mark and travels 15 m in 5 s putting her 20 m from the zero point at 5s. Graph the motion and write the equation in slope-intercept form. 3. A boy runs at 4m/s at 5 s he is at the 24 meter mark. Graph the motion and write the equation in the slope-intercept form. 4. Given the equation y=3x + 4 describe the motion of the object giving slope velocity and starting position. __________________________________________________________________________________________________ __________________________________________________________________________________________________ 5. Read the following story and write an equation (in slope intercept form) that describes the motion of each person. Kim and Steve are having a race. Kim knows she is faster so she gives Steve a 3 m head start. Kim runs a 4 m/s and Steve runs at 3 m/s. Kim’s equation: __________________________________________ Steve’s equation: ________________________________________ 6. Jamal runs 30 meters in 5s what is Jamal’s velocity. (Show Work) 7. Timmy and Tonya race toy cars both cars run a 2 m/s Tonya starts 1 m in front of Timmy. What do we know about the slopes of the graphs for their motion. _____________________________________ Write an equation for each car. Timmy _____________________ Tonya ___________________________ 8. When looking at a graph showing the motion of more than one object and you see the parallel lines what does that tell you about the objects. ______________________________________________________________ 9. If the motion of an object is constant what do we know about the force moving the object? ____________________________________________________________________________ 10. If the force moving an object decreases what does the object do? ___________________________________________________________

