Linear Motion - Dry Lab
advertisement
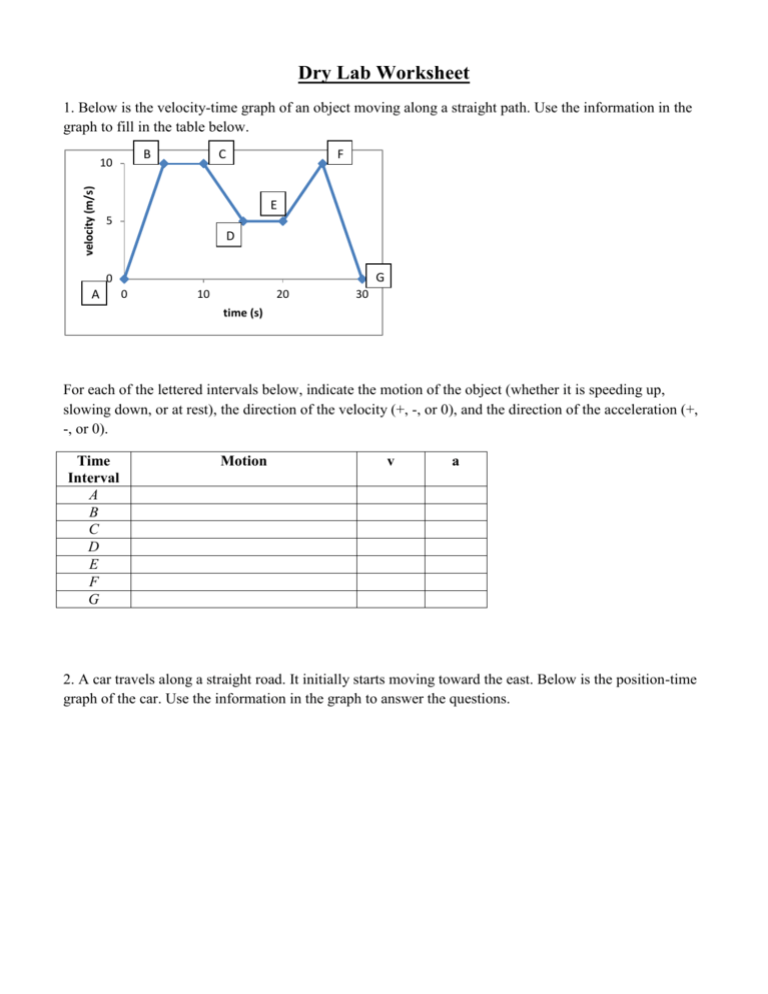
Dry Lab Worksheet 1. Below is the velocity-time graph of an object moving along a straight path. Use the information in the graph to fill in the table below. B velocity (m/s) 10 C F E 5 D G 0 A 0 10 20 30 time (s) For each of the lettered intervals below, indicate the motion of the object (whether it is speeding up, slowing down, or at rest), the direction of the velocity (+, -, or 0), and the direction of the acceleration (+, -, or 0). Time Interval A B C D E F G Motion v a 2. A car travels along a straight road. It initially starts moving toward the east. Below is the position-time graph of the car. Use the information in the graph to answer the questions. 15 position (m) 10 5 t1 t2 t3 t4 t5 t6 t7 10 20 30 40 50 60 70 0 0 -5 time (s) a) Does the car move to the east? If so, during which time interval(s)? b) Does the car move to the west? If so, during which time interval(s)? c) Is the car’s speed between t1 and t2 greater than, less than, or equal to its speed between t2 and t3? d) Is the car’s speed between t4 and t5 greater than, less than, or equal to its speed between t6 and t7? e) Does the car ever stop completely? If so, at which time(s)? f) Does the ever move with a constant velocity? If so, at which time(s)? g) What is the total displacement of the car during the trip? 3. Use the following vectors to answer the questions. I B F A D E C G H J A= 5m B= 3m C= 5m D= 4m E= 5m F= 3m G=4m H=5m I= 5m J= 3m a) Which vectors have the same magnitude? b) Which vectors have the same direction? c) Which arrows, if any, represent the same vector? d) Construct and label a diagram that shows the vector sum A + 2B. Construct and label a second diagram that shows 2B + A. e) Construct and label a diagram that shows the vector sum A - B. Construct and label a second diagram that shows B - A. a) Determine the acceleration of a vehicle over a time of 30 seconds? 4. Use the velocity-time graph shown below, which illustrates the motion of a vehicle over a time of 30 seconds to answer the following questions. B 30 b) At which point(s) is the velocity of the vehicle zero? C velocity (m/s) 20 10 D 0 -10 0 A 5 10 G 15 20 time (s) E 30 c) Identify the interval(s) where the acceleration of the vehicle is zero? 25 -20 -30 F 5. Use the velocity-time graph, of a car, shown below, to answer the following questions. C B velocity (m/s) 10 0 A 0 1 2 3 4 5 time (s) position (m) 50 D 6 a) How far is the car from where it started? 0 0 50 time (s) b) What is the acceleration of the car at points A + B and C-D? c) At what interval is the acceleration of the car zero? velocity (m/s) 50 0 0 50 time (s) 1) What is the slope of each graph? 2) What does the slope of each graph indicate?

