Weather-oldsalt
advertisement
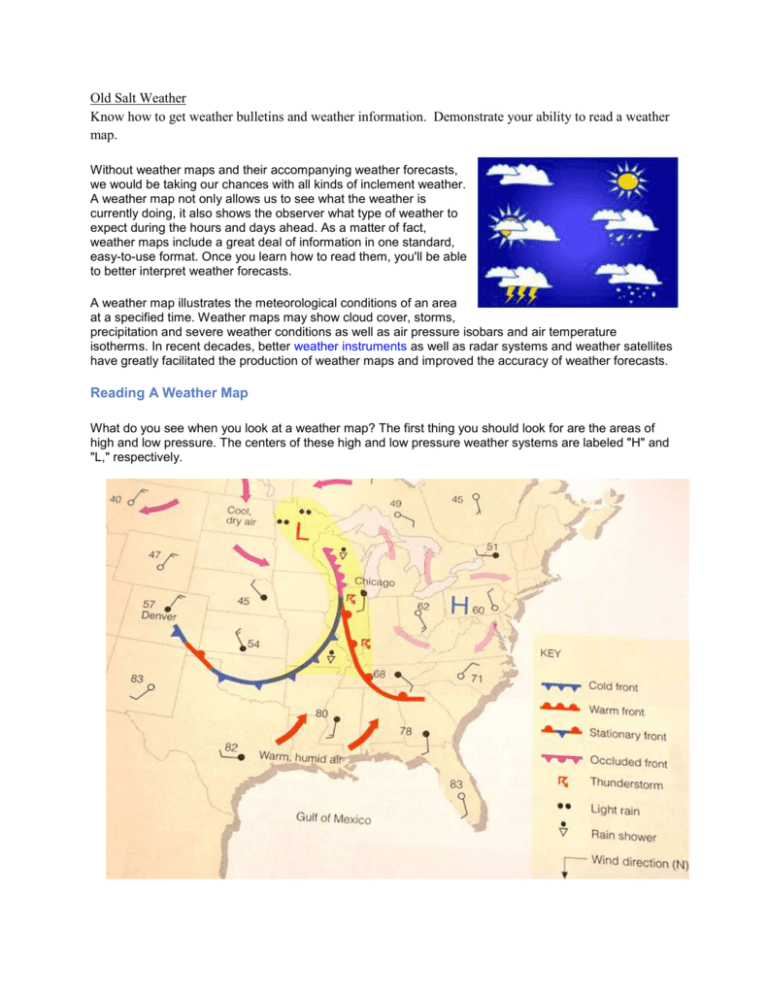
Old Salt Weather Know how to get weather bulletins and weather information. Demonstrate your ability to read a weather map. Without weather maps and their accompanying weather forecasts, we would be taking our chances with all kinds of inclement weather. A weather map not only allows us to see what the weather is currently doing, it also shows the observer what type of weather to expect during the hours and days ahead. As a matter of fact, weather maps include a great deal of information in one standard, easy-to-use format. Once you learn how to read them, you'll be able to better interpret weather forecasts. A weather map illustrates the meteorological conditions of an area at a specified time. Weather maps may show cloud cover, storms, precipitation and severe weather conditions as well as air pressure isobars and air temperature isotherms. In recent decades, better weather instruments as well as radar systems and weather satellites have greatly facilitated the production of weather maps and improved the accuracy of weather forecasts. Reading A Weather Map What do you see when you look at a weather map? The first thing you should look for are the areas of high and low pressure. The centers of these high and low pressure weather systems are labeled "H" and "L," respectively. You'll also want to look for isobars. Isobars are lines of equal air pressure; in most cases they are labeled with a number that represents the air pressure in hectopascals, or millibars. The air pressure is higher near the center of a high-pressure weather system, while it is lower near the center of a low-pressure system. You can tell a lot about the weather by the isobars' proximity to each other. Isobars that are closely spaced mean strong winds, which usually go hand-in-hand with low-pressure systems. Bars that are spaced far apart generally indicate calm, high-pressure systems. In other words, blue skies! The isobars will also show how the winds are flowing around the primary highs and lows on a weather map, as well as whether they are drawing in air from lower or higher latitudes. In the Northern Hemisphere, wind flows in a counter-clockwise direction around lows and in a clockwise direction around highs; in the Southern Hemisphere the opposite is true. By following the isobars out from the center and determining the wind direction, you can tell where the wind is coming from. These air flow patterns are important, because a wind's direction and source will greatly influence the type of weather it brings. For example, air from high latitudes in winter is cold and dry, while air drawn from low latitudes will be humid and warm. Weather maps can also show boundaries between air masses of differing temperatures. These boundaries, called fronts, are indicated by cold front and warm front lines. Cold fronts are indicated by lines with triangles; warm fronts are indicated by lines with hemispheres. In most cases, frontal systems will bring weather changes. The triangles and hemispheres on a front line indicate the direction of frontal movement. A non-moving, stationary front is indicated by a line with triangles on one side and hemispheres on the other side. The ability to read a weather map will make weather forecasts easier to understand and more informative. Most newspapers feature fairly simple weather maps. Some of them show isobars, while others do not. Most newspaper weather maps do show primary high and low pressure areas as well as cold fronts, warm fronts, and stationary fronts. To learn even more about the weather, many people now use both weather maps and satellite images. While satellite images show cloud formations, weather maps show how the weather is moving, where the air masses are coming from, and where the fronts are. Used together, it's easy to see how the atmosphere creates weather! This knowledge of weather allows people to see dangerous weather patterns such as snow storms and tropical storms before they arrive, so that protective measures can be taken. Weather Radar Maps Weather radar uses pulsed microwave radiation pulses to detect various degrees and forms of precipitation including light rain, heavy rain, snow, and hailstones. In some cases, Doppler radar is also used to determine wind velocities and directions. For local and regional Doppler radar maps and images, visit the National Weather Service Doppler Radar page. Related Weather Website National Weather Service The National Weather Service (NWS) provides weather, hydrologic, and climate forecasts and warnings for the United States, its territories, and adjacent waters and ocean areas. NWS data and products form a national information database and infrastructure that can be used by other governmental agencies, the private sector, and the general public. www.NWS.NOAA.gov United States Weather Forecast Map This North America weather forecast map is normally updated at about 7am Eastern time. Click on the map for more information and local weather forecasts. Graphical Weather Forecast Map This graphical weather forecast map shows minimum temperatures and is normally updated about every 30 minutes. Click on the map for additional graphical weather forecast elements. Graphical Weather Forecast Map This graphical weather forecast map shows maximum temperatures and is normally updated about every 30 minutes.
