Supplementary Information (docx 20K)
advertisement
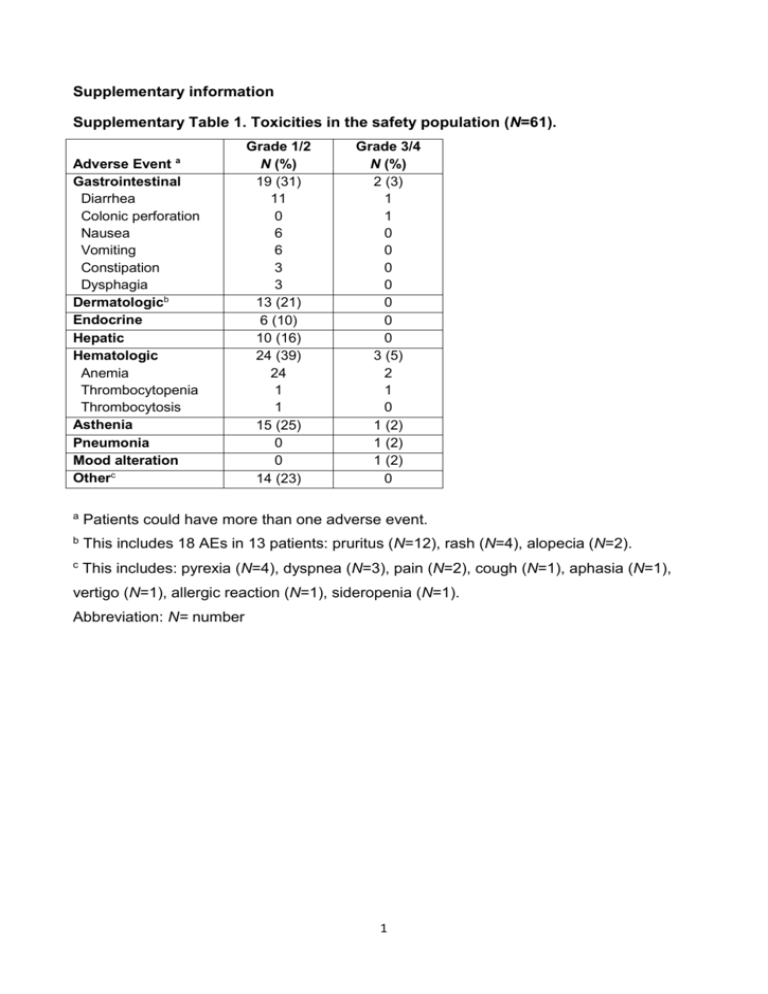
Supplementary information Supplementary Table 1. Toxicities in the safety population (N=61). Adverse Event a Gastrointestinal Diarrhea Colonic perforation Nausea Vomiting Constipation Dysphagia Dermatologicb Endocrine Hepatic Hematologic Anemia Thrombocytopenia Thrombocytosis Asthenia Pneumonia Mood alteration Otherc Grade 1/2 N (%) 19 (31) 11 0 6 6 3 3 13 (21) 6 (10) 10 (16) 24 (39) 24 1 1 15 (25) 0 0 14 (23) Grade 3/4 N (%) 2 (3) 1 1 0 0 0 0 0 0 0 3 (5) 2 1 0 1 (2) 1 (2) 1 (2) 0 a Patients could have more than one adverse event. b This includes 18 AEs in 13 patients: pruritus (N=12), rash (N=4), alopecia (N=2). c This includes: pyrexia (N=4), dyspnea (N=3), pain (N=2), cough (N=1), aphasia (N=1), vertigo (N=1), allergic reaction (N=1), sideropenia (N=1). Abbreviation: N= number 1 Supplementary Table 2. The relationship between NLR thresholds and irPD NLR cutoff Specificitya 3 68% (43-87) 4 89% (67-99) 5 95% (74-100) Sensitivitya Likelihood ratio 78% (64-88) 2.47 52% (37-66) 4.94 44% (30-59) 8.36 Abbreviations: NLR= neutrophil to lymphocyte ratio; irPD= immune-related progressive disease a Value and 95% confidence interval for each threshold are reported. 2 Supplementary Table 3. Univariate analysis of the associations of baseline patient characteristics (N=69) and survival. Disease progression Parameter HR 95% CI P valuea Overall survival HR 95% CI P valuea Age (<65 vs ≥ 65 yrs) 1.06 0.64-1.77 0.80 0.81 0.46-1.43 0.52 Sex (F vs M) 0.74 0.45-1.22 0.22 0.70 0.40-1.21 0.22 LDH (<ULN vs ≥ ULN) 0.47 0.28-0.80 0.03 0.60 0.34-1.06 0.11 ECOG PS (0-1 vs 2) 0.16 0.05-0.53 <0.0001 0.08 0.02-0.30 <0.0001 NLR (<5 vs ≥5) 0.20 0.10-0.41 <0.0001 0.12 0.05-0.25 <0.0001 WBC (<ULN vs ≥ULN) 0.14 0.05-0.35 <0.0001 0.06 0.02-0.18 <0.0001 ANC (<ULN vs ≥ULN) 0.20 0.09-0.45 0.0004 0.12 0.05-0.28 <0.0001 ALC (≤LLN vs >LLN) 1.49 0.80-2.78 0.07 2.03 1.02-4.07 0.04 a P values are from Wilcoxon test Abbreviations: N= number; HR= hazard ratio; CI= confidence interval; F= female; M= male; LDH= lactate dehydrogenase; ULN= upper limit of normal; LLN= lower limit of normal; ECOG PS= European Cooperative Oncology Group performance status; NLR= neutrophil to lymphocyte ratio; WBC= white blood cells; ANC= absolute neutrophil count; ALC= absolute lymphocyte count. 3 Supplementary Table 4. Multivariate analysis of the associations of baseline features and survival of patients receiving at least two drug infusions (N=59). Disease progression P valuea HR 95% CI P valuea Parameter HR Age 0.99 0.97-1.02 0.46 1.00 0.97-1.03 0.98 Sex (F vs M) 0.85 0.48-1.50 0.57 0.73 0.38-1.39 0.34 LDH (<ULN vs ≥ ULN) 0.70 0.39-1.25 0.23 0.99 0.51-1.90 0.97 ECOG PS (0-1 vs 2) 0.78 0.18-3.44 0.74 0.55 0.12-2.48 0.44 NLR (<5 vs ≥5) 0.46 0.24-0.87 0.02 0.26 0.13-0.53 0.0002 a 95% CI Overall survival P values are from Cox model adjusted for age, gender, LDH and ECOG PS Abbreviations: HR= hazard ratio; CI= confidence interval; F= female; M= male; LDH= lactate dehydrogenase; ULN= upper limit of normal; ECOG PS= European Cooperative Oncology Group performance status; NLR= neutrophil to lymphocyte ratio 4 Supplementary Table 5. Validation of the association of NLR and overall survival in patients receiving 10 mg/kg ipilimumab (N=27). HR Age 1.02 0.97-1.07 0.49 Sex (F vs M) 0.63 0.23-1.72 0.37 LDH (<ULN vs ≥ ULN) 0.41 0.16-1.02 0.055 NLR (<5 vs ≥5) 0.03 a 95% CI P valuea Parameter 0.26 0.08-0.88 P values are from Cox model adjusted for age, gender and LDH Abbreviations: HR= hazard ratio; CI= confidence interval; F= female; M= male; LDH= lactate dehydrogenase; ULN= upper limit of normal; NLR= neutrophil to lymphocyte ratio 5 Legend to Supplementary Figure 1. Baseline white blood cell counts (WBC, A), absolute neutrophil count (ANC, B), absolute lymphocyte counts (ALC, C) and neutrophil to lymphocyte ratio (NLR, D) in patients that experienced disease progression (irPD) or disease control (irDC) as best overall response to ipilimumab therapy. P values were calculated with Mann-Whitney U test. 6
