Econ 290 Week 2 tutorial
advertisement
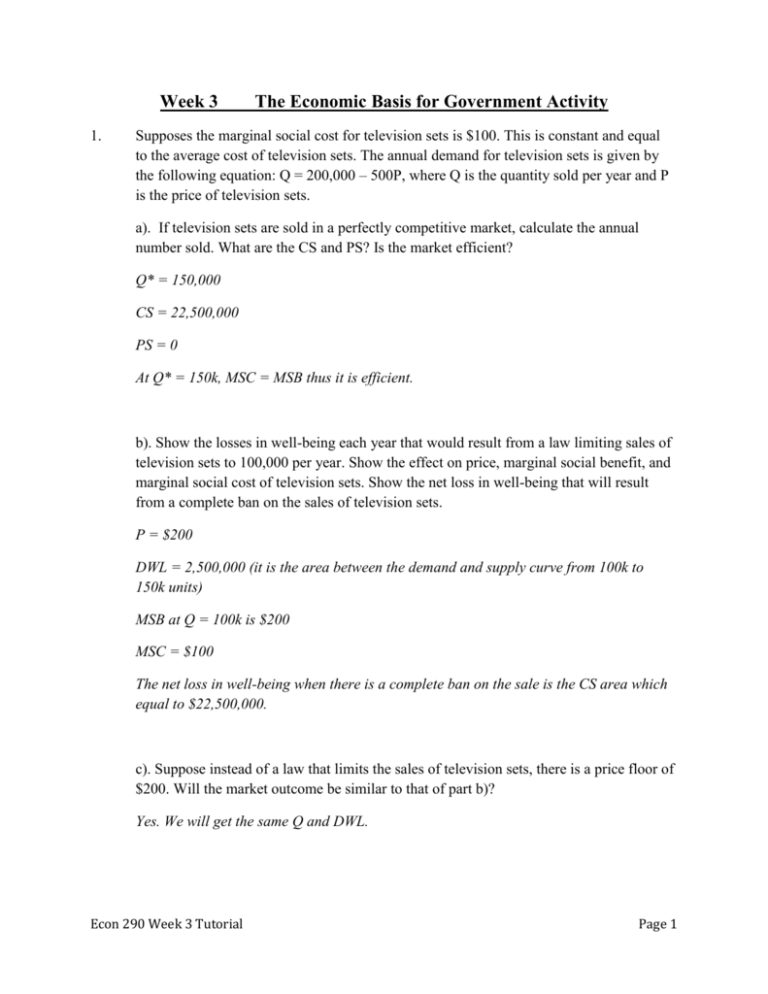
Week 3 1. The Economic Basis for Government Activity Supposes the marginal social cost for television sets is $100. This is constant and equal to the average cost of television sets. The annual demand for television sets is given by the following equation: Q = 200,000 – 500P, where Q is the quantity sold per year and P is the price of television sets. a). If television sets are sold in a perfectly competitive market, calculate the annual number sold. What are the CS and PS? Is the market efficient? Q* = 150,000 CS = 22,500,000 PS = 0 At Q* = 150k, MSC = MSB thus it is efficient. b). Show the losses in well-being each year that would result from a law limiting sales of television sets to 100,000 per year. Show the effect on price, marginal social benefit, and marginal social cost of television sets. Show the net loss in well-being that will result from a complete ban on the sales of television sets. P = $200 DWL = 2,500,000 (it is the area between the demand and supply curve from 100k to 150k units) MSB at Q = 100k is $200 MSC = $100 The net loss in well-being when there is a complete ban on the sale is the CS area which equal to $22,500,000. c). Suppose instead of a law that limits the sales of television sets, there is a price floor of $200. Will the market outcome be similar to that of part b)? Yes. We will get the same Q and DWL. Econ 290 Week 3 Tutorial Page 1 2. Consider the market for cigarettes. Suppose the market demand and supply curves are as given below. In each case, quantity refers to millions of packs of cigarettes per month; price is the price per pack (dollars). Demand: P = 100 – 2Qd Supply: P = 10 + QS a) Plot the demand and supply curves on a supply/demand diagram. I believe you can do it b) Compute the equilibrium price and quantity. P* = $40 and Q* = 30 c) Now suppose the government imposes a tax of 15 dollars per pack. Show how does it affect the market equilibrium. What is the new “consumer price” and what is the new “producer price”? Show them on your diagram. Supply function with tax is P = 25 + Q Pc = $50 and Pp = $35, Qt = 25 d) Compute the total revenue raised by the cigarette tax. What share is “paid” by producers? What share is “paid” by consumer? Total tax revenue = $375 Tax paid by consumers = $250 Tax paid by producers = $125 e) What is the CS, PS and DWL associated with the tax? CS = $625 PS = $312.5 DWL = $37.5 Econ 290 Week 3 Tutorial Page 2 3. Suppose that the following represents the labour for Toronto. Graph the following information for the market. Wages (In dollars per hour) 15 11 7 3 Quantity Demanded 3800 4200 4600 5000 Quantity Supplied 5000 4800 4600 4400 a) What is the equilibrium employment and wage in the Toronto labour market? L* = 4600 and W* = $7 b) Suppose that the government places $11 price control on the market, what kind of price control is this? (Please name it) Minimum wage c) If this $11 wage control is imposed, show this on your graph. What is the new quantity supplied and quantity demanded in the market? How many jobs are destroyed by this policy. Ls = 4800 and Ld = 4200 Number of job destroyed = 4600 – 4200 = 400 d) Discuss what would be a rational for such intervention. Who gains from this policy and who loses? The government want to help the poor. Gainer: who still get employed Loser: employers and those who lose their jobs Econ 290 Week 3 Tutorial Page 3


