SUPPORTING INFORMATION
advertisement
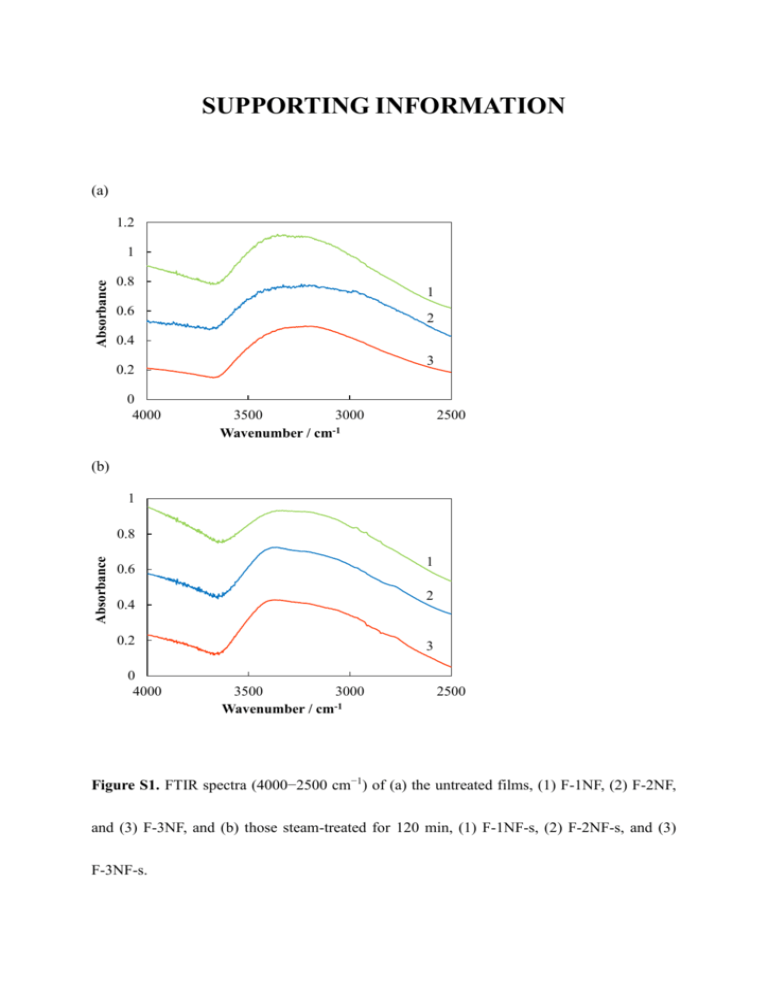
SUPPORTING INFORMATION (a) 1.2 Absorbance 1 0.8 1 0.6 2 0.4 3 0.2 0 4000 3500 3000 -1 Wavenumber / cm 2500 (b) 1 Absorbance 0.8 1 0.6 2 0.4 0.2 0 4000 3 3500 3000 -1 Wavenumber / cm 2500 Figure S1. FTIR spectra (4000−2500 cm−1) of (a) the untreated films, (1) F-1NF, (2) F-2NF, and (3) F-3NF, and (b) those steam-treated for 120 min, (1) F-1NF-s, (2) F-2NF-s, and (3) F-3NF-s. (a) 0.8 Absorbance 0.6 1 0.4 2 0.2 3 0 400 450 500 550 600 Wavelength / nm (b) Absorbance 0.2 1 0.1 2 3 0 400 450 500 550 600 Wavelength / nm Figure S2. Visible absorption spectra and the separated constituent spectra of (a) the untreated films, (1) F-1NF, (2) F-2NF, and (3) F-3NF, and (b) those steam-treated for 120 min, (1) F-1NF-s, (2) F-2NF-s, and (3) F-3NF-s. (a) Emission intensity 10000 1 2 3 1000 100 10 1 0 2 4 6 8 10 Time / ns (b) Emission intensity 10000 1 2 3 1000 100 10 1 0 2 4 6 8 10 Time / ns Figure S3. Fluorescence decay profiles of (a) the untreated films, (1) F-1NF, (2) F-2NF, and (3) F-3NF, and (b) those steam-treated for 120 min, (1) F-1NF-s, (2) F-2NF-s, and (3) F-3NF-s. A Ti:Sapphire femtosecond pulse laser and streak scope spectroscopic system were used for the time-resolved fluorescence measurements in order to obtain information about the fluorescence quenching due to the electron injection from the dye to the titania. The laser system (Clark MXR CPA 2001) generates laser pulses of 150 fs duration (FWHM) with an energy of 750 μJ at 750 nm and a repetition rate of 1 kHz. laser pulses (375 nm) was used for the excitation. The second harmonics of the The fluorescence signal was monitored using a streak scope system (Hamamatsu Photonics C4780). The fluorescence decay curves were obtained by integrating the fluorescence signals in the 500–550 nm region. The film samples for this measurement were washed with a 0.1 mol dm3 sodium hydroxide aqueous solution and water in order to adjust to the same amount of the dye. of the dye was confirmed by a UV-visible absorption measurement. The amount Table S1. Emission intensity and fitting parameters of the time-resolved fluorescence of (a) the untreated films, (1) F-1NF, (2) F-2NF, and (3) F-3NF, and (b) those steam-treated for 120 min, (1) F-1NF-s, (2) F-2NF-s, and (3) F-3NF-s. Maximum intensity τ1 / ns τ2 / ns A1 A2 F-1NF 2030±70 0.40±0.01 3.7±0.1 0.96±0.01 0.04±0.01 F-2NF 2320±60 0.42±0.01 3.5±0.1 0.95±0.01 0.05±0.01 F-3NF 2540±50 0.43±0.01 3.5±0.1 0.90±0.02 0.10±0.02 F-1NF-s 950±40 0.20±0.01 3.3±0.1 0.98±0.01 0.02±0.01 F-2NF-s 1360±50 0.24±0.01 3.3±0.1 0.97±0.01 0.03±0.01 F-3NF-s 2150±80 0.25±0.01 3.4±0.1 0.96±0.01 0.04±0.01 (a) 100 nm (b) 100 nm Figure S4. SEM images of the surface morphology of the electrodes steam-treated for 120 min, (a) WE-2HF-s and (b) WE-2SF-s. Intensity (arb. units) 20 1 2 3 25 30 35 40 45 50 2θ / degree Figure S5. XRD patterns of the films steam-treated for 120 min, (2) F-2NF-s, (3) F-2HF-s, and (4) F-2SF-s. (a) 0.7 Absorbance 0.6 1 0.5 0.4 2 0.3 3 0.2 0.1 0 1800 1600 1400 Wavenumber / cm-1 1200 1000 (b) Absorbance 0.8 1 0.6 2 0.4 3 0.2 0 1800 1600 1400 Wavenumber / cm-1 1200 1000 Figure S6. FTIR spectra (1800−1000 cm−1) of (a) the untreated films, (1) F-2NF, (2) F-2HF, and (3) F-2SF, and (b) those steam-treated for 120 min, (1) F-2NF-s, (2) F-2HF-s, and (3) F-2SF-s. (a) 1 Absorbance 0.8 1 0.6 2 0.4 0.2 0 4000 3 3500 3000 -1 Wavenumber / cm 2500 (b) 1 Absorbance 0.8 1 0.6 0.4 2 0.2 3 0 4000 3500 3000 -1 Wavenumber / cm 2500 Figure S7. FTIR spectra (4000−2500 cm−1) of (a) the untreated films, (1) F-2NF, (2) F-2HF, and (3) F-2SF, and (b) those steam-treated for 120 min, (1) F-2NF-s, (2) F-2HF-s, and (3) F-2SF-s. (a) 0.8 Absorbance 0.6 1 0.4 2 0.2 3 0 400 450 500 550 600 Wavelength / nm (b) 0.4 1 Absorbance 0.3 0.2 0.1 2 3 0 400 450 500 550 600 Wavelength / nm Figure S8. Visible absorption spectra and the separated constituent spectra of (a) the untreated films, (1) F-2NF, (2) F-2HF, and (3) F-2SF, and (b) those steam-treated for 120 min, (1) F-2NF-s, (2) F-2HF-s, and (3) F-2SF-s. Table S2. Concentrations (/ mol dm−3) of the neutral, anion, and dianion species of fluorescein in the untreated films, F-2NF, F-2HF, and F-2SF, and those steam-treated for 120 min, F-2NF-s, F-2HF-s, and F-2SF-s. Neutral Anion Dianion Total F-2NF 0.131 (26.1%) 0.364 (72.5%) 0.00705 (1.4%) 0.502 F-2HF 0.00986 (21.5%) 0.352 (76.8%) 0.00778 (1.7%) 0.459 F-2SF 0.141 (29.6%) 0.332 (69.5%) 0.00474 (1.0%) 0.479 F-2NF-s 0.00648 (27.5%) 0.164 (69.5%) 0.00717 (3.0%) 0.236 F-2HF-s 0.109 (26.2%) 0.00633 (1.5%) 0.416 F-2SF-s 0.00527 (21.6%) 0.0187(76.7%) 0.301 (72.3%) 0.000420 (1.7%) 0.0244 (a) 30 Intensity 3 20 2 1 10 0 500 550 600 650 700 650 700 Wavelength / nm (b) 10 2 Intensity 8 6 1 4 3 2 0 500 550 600 Wavelength / nm Figure S9. Fluorescence spectra of (a) the untreated films, (1) F-2NF, (2) F-2HF, and (3) F-2SF, and (b) those steam-treated for 120 min, (1) F-2NF-s, (2) F-2HF-s, and (3) F-2SF-s. The excitation wavelength was 500 nm. (a) 8 0.3 1 1 2 3 4 IPCE / % IPCE / % 6 0.2 2 0.1 2 3 0 0 300 320 340 360 380 400 400 450 Wavelength / nm 500 550 Wavelength / nm 600 (b) 8 1 1 1 2 3 4 IPCE / % IPCE / % 6 0.5 2 2 3 0 0 300 320 340 360 Wavelength / nm 380 400 400 450 500 550 Wavelength / nm 600 Figure S10. IPCE spectra of (a) the untreated electrodes, (1) WE-2NF, (2) WE-2HF, and (3) WE-2SF, and (b) those steam-treated for 120 min, (1) WE-2NF-s, (2) WE-2HF-s, and (3) WE-2SF-s. Photocurrent density / μA cm-2 10 1 8 2 6 3 4 2 0 0 0.1 0.2 0.3 0.4 Voltage / V Figure S11. I−V curves of the untreated electrodes, (1) WE-2NF, (2) WE-2HF, and (3) WE-2SF. The I−V curves of the electrodes were measured by a potentiostat (Hokuto Denko HSV-100) during irradiation by the visible light at a wavelength longer than 400 nm emitted by the 150-W Xe short arc lamp using a sharp cut filter.

