Supplementary Material
advertisement
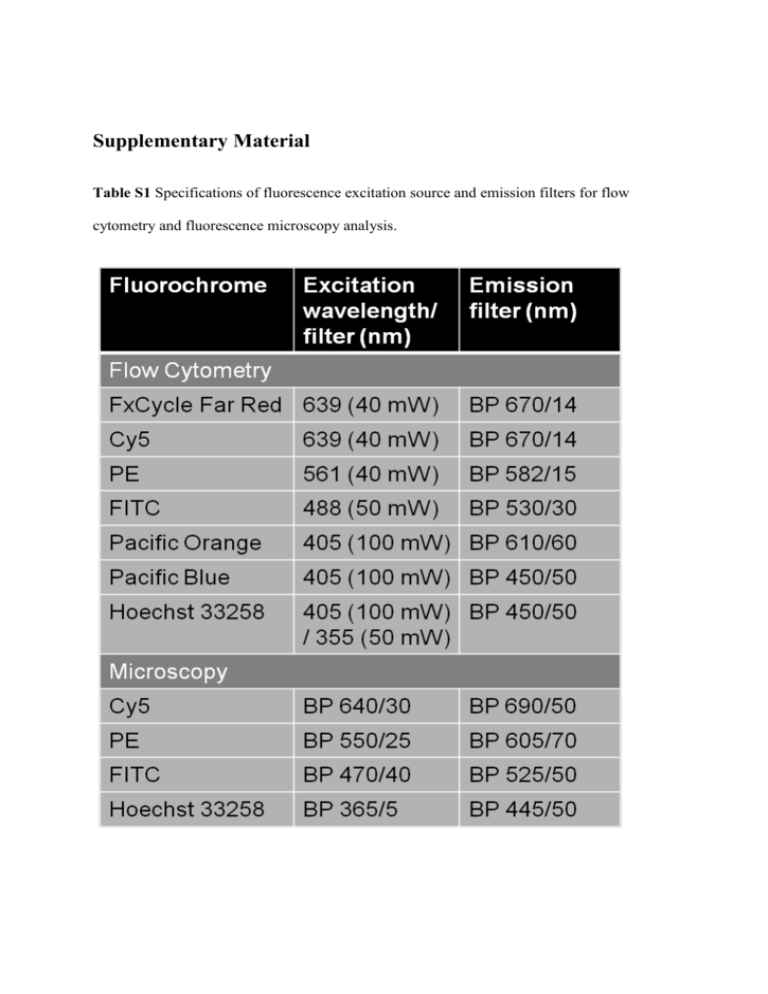
Supplementary Material Table S1 Specifications of fluorescence excitation source and emission filters for flow cytometry and fluorescence microscopy analysis. Fig. S1. Dose response curves of relative live cell numbers in Reh, U698, Granta-519 and JVM-2 as a function of PARP inhibitor concentration after 72 h treatment with/without 10 μM ATM inhibitor. Mean value from three independent experiments ±SEM (*p<0.05,**p<0.001). Fig. S2. Nocodazole induced mitotic arrest during 18-24 h and 66-72 h of PARP and/or 10 μM ATM inhibition. The controls were harvested at 24 h and 72 h. Fig. S3. Dose response curves of cell death in Reh, U698, Granta-519 and JVM-2 as a function of PARP inhibitor concentration after 72 h treatment with/without 10 μM ATM inhibitor. Mean value from three independent experiments ±SEM (*p<0.05,**p<0.001). Fig. S4. Regions and strategy for gating in flow cytometry experiments. Doublets were first excluded using the pulse width of the Hoechst 33258 fluorescence signal (not shown in figure). The fraction of apoptotic cells was obtained from the panel A, mitotic cells from panel B, and G1/S/G2 from panel C by simulation of the DNA content distributions after removal of mitotic cells. The regions shown were used to assess γH2AX content in the different phases (panel E). In some experiments (upper right quadrant) control cells barcoded with Pacific Blue were gated and analyzed in parallel with the treated cells stained in the same sample (pre-fixation Pacific Orange-staining substituted the TUNEL-assay in these experiments). Reh cells treated with 3µM olaparib (PARP inhibitor) and 10 µM KU-55933 (ATM inhibitor) for 72 h is shown as an example. Fig. S5. Dose response curves of 72 h treatment with PARP inhibitor and/or 10 μM ATM inhibitor on induction of apoptosis. Mean value of single, TUNEL positive cells ±SEM (*p<0.05,**p<0.001). Fig. S6. Correlation of dead cells (as measured by cell permeability of PI) and apoptotic cells (as measured by the TUNEL assay). Ordinary linear regressions of dead cell fraction as a function of apoptotic cell fraction in the 24 differentially treated samples of PARP and/or ATM inhibited Reh, U698, JVM-2 and Granta-519 (mean values from three independent experiments). The dotted lines represent the 95% confidence interval of the regression coefficient. Fig. S7. Dose response curves of the effect of 72 h treatment with PARP and/or ATM inhibition (10 μM ATMi) on accumulation of cells in G2 phase. Mean value from three independent experiments ±SEM (*p<0.05,**p<0.001). Fig. S8. Changes in cell cycle phase duration for Reh, U698, JVM-2 and Granta-519 after 24h PARP inhibitor and/or 10 μM ATM inhibitor treatment. The duration was calculated based on the apparent cell cycle times obtained from the slopes in Figure 1, and the cell cycle distributions. It was assumed that the distribution of cells in the cell cycle was exponential. Mean cell cycle phase durations (h) are listed in the table below the column chart of each cell line. The G2 fraction and the calculated cell cycle phase durations could have been overestimated for the samples in which failed cytokinesis was observed at later treatment times (marked with an asterix). Moreover, extensive cell death may lead to overestimation of the lengths of cell cycle phases, as dead cells are not part of the growth fraction. Samples with significant increase in apoptosis and/or necrosis at 24 h are marked with a cross.
