eee 413 digital signal processing lab assignment 4
advertisement
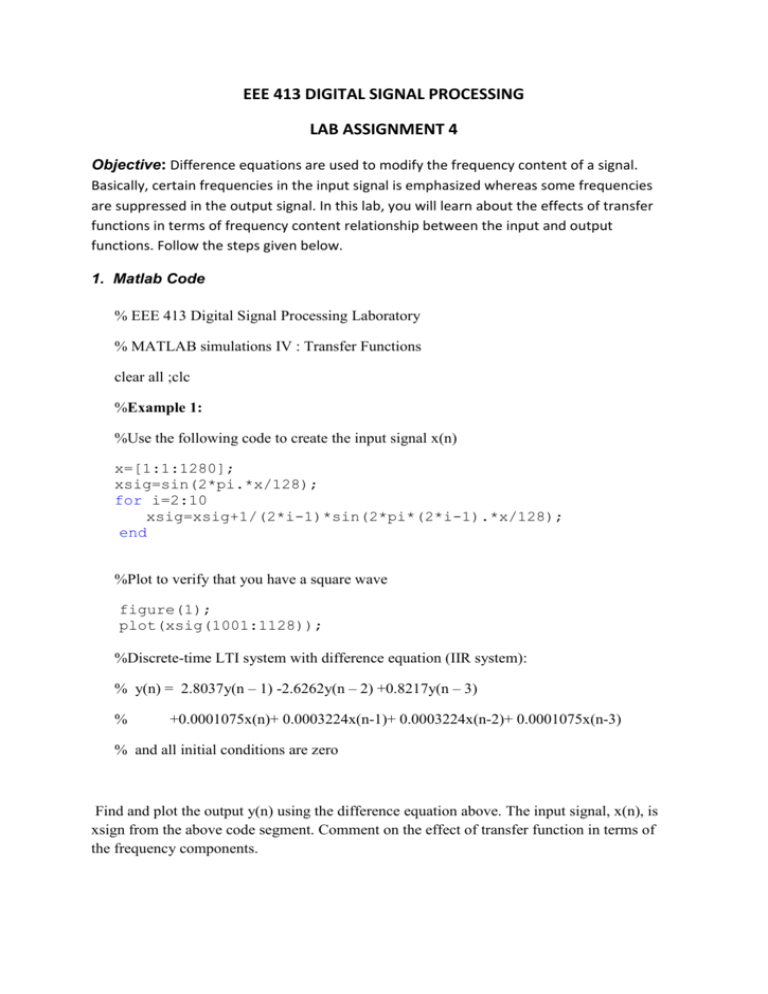
EEE 413 DIGITAL SIGNAL PROCESSING LAB ASSIGNMENT 4 Objective: Difference equations are used to modify the frequency content of a signal. Basically, certain frequencies in the input signal is emphasized whereas some frequencies are suppressed in the output signal. In this lab, you will learn about the effects of transfer functions in terms of frequency content relationship between the input and output functions. Follow the steps given below. 1. Matlab Code % EEE 413 Digital Signal Processing Laboratory % MATLAB simulations IV : Transfer Functions clear all ;clc %Example 1: %Use the following code to create the input signal x(n) x=[1:1:1280]; xsig=sin(2*pi.*x/128); for i=2:10 xsig=xsig+1/(2*i-1)*sin(2*pi*(2*i-1).*x/128); end %Plot to verify that you have a square wave figure(1); plot(xsig(1001:1128)); %Discrete-time LTI system with difference equation (IIR system): % y(n) = 2.8037y(n – 1) -2.6262y(n – 2) +0.8217y(n – 3) % +0.0001075x(n)+ 0.0003224x(n-1)+ 0.0003224x(n-2)+ 0.0001075x(n-3) % and all initial conditions are zero Find and plot the output y(n) using the difference equation above. The input signal, x(n), is xsign from the above code segment. Comment on the effect of transfer function in terms of the frequency components. %Example 2: % Discrete-time LTI system with difference equation (FIR system): x(n) % y(n) = 0.0141x(n)+ 0.0301x(n-1)+ 0.0721x(n-2)+ 0.1245 x(n-3)+0.1673x(n-4) % +0.1838x(n-5)+ 0.1673x(n-6)+ 0.1245x(n-7)+0.0721x(n-8) +0.0301x(n-9)+0.0141x(n-10) Find and plot the output y(n) using the difference equation above. The input signal, x(n), is xsign from the previous example. Comment on the effect of transfer function in terms of the frequency components. Compare the performance of transfer functions in example one and two, and comment on 2. Assignment (Due on 04-11-2015) a. Define a triangular input waveform using the following code sequence: x=[0.1:0.1:128]; xsig=sawtooth(x,0.5); b. Apply the transfer functions in examples 1 and 2 to this input. Plot both outputs. Comment on the output waveforms in terms of the frequency content.


