N O T E
IFAD-IFPRI Partnership Program - Climate Mitigation Activity
FEBRUARY 2012
2033 K Street, NW, Washington, DC 20006-1002 USA • T: +1-202-862-5600 • F: +1-202-467-4439 • www.ifpri.org
National-level Crop Mitigation Potential for key Food Crops in
Vietnam
William Salas, Changcheng Li, Pete Ingraham, Mai Van Trinh, Dao The Anh, Nguyen Ngoc Mai and Claudia Ringler
Vietnam remains a country heavily grounded in agriculture. In 2010,
approximately 63% of the working population was active in
agriculture. By 2020, the share is expected to still be 59%. The rural
areas also harbor the majority of Vietnam’s poor people. At the
same time, Vietnam has enjoyed very rapid growth across all major
sectors, with overall GDP growth of 6-8% over the last decade. As a
result, greenhouse gas (GHG) emissions per capita have increased
exponentially. While Vietnam is responsible for a very small share of
global greenhouse gas emissions, the country accounts for a
significant share of GHG mitigation potential through improved
agricultural practices as well as improvements in other sectors.
Emissions reductions in agriculture could be a source of millions of
dollars a year of income for farmers in the country, which could be
used by farmers to adapt to the adverse consequences of climate
change.
The importance of agricultural mitigation has recently been
affirmed by the Government of Vietnam through Decision 3119
/QD-BNN-KHCN of Dec 16, 2011, which suggests to reduce, by 2020,
by 20% total GHG emissions in the agriculture and rural
development sector (~19 million tons of CO 2 equivalent), while
reducing poverty and continue agricultural and economic growth
and effectively respond to climate change. While this is a tall order,
the country is well equipped to make significant advances in this
regard.
This brief is based on a study to assess emissions from the
production of key food crops in Vietnam and to assess the potential
of alternative mitigation options in agriculture.
National-level emissions from agriculture
Vietnam’s Second National Communication to the United Nations
Framework Convention on Climate Change (UNFCCC), dated 2010,
reports total emissions of 151 million tons of GHG in carbon dioxidec
equivalent (CO2e), up from 104 million tons of emissions in CO2e in
1994, an increase of 6.4%/yr. Fifty-three percent of the total
volume of emissions was contributed by agriculture and land use
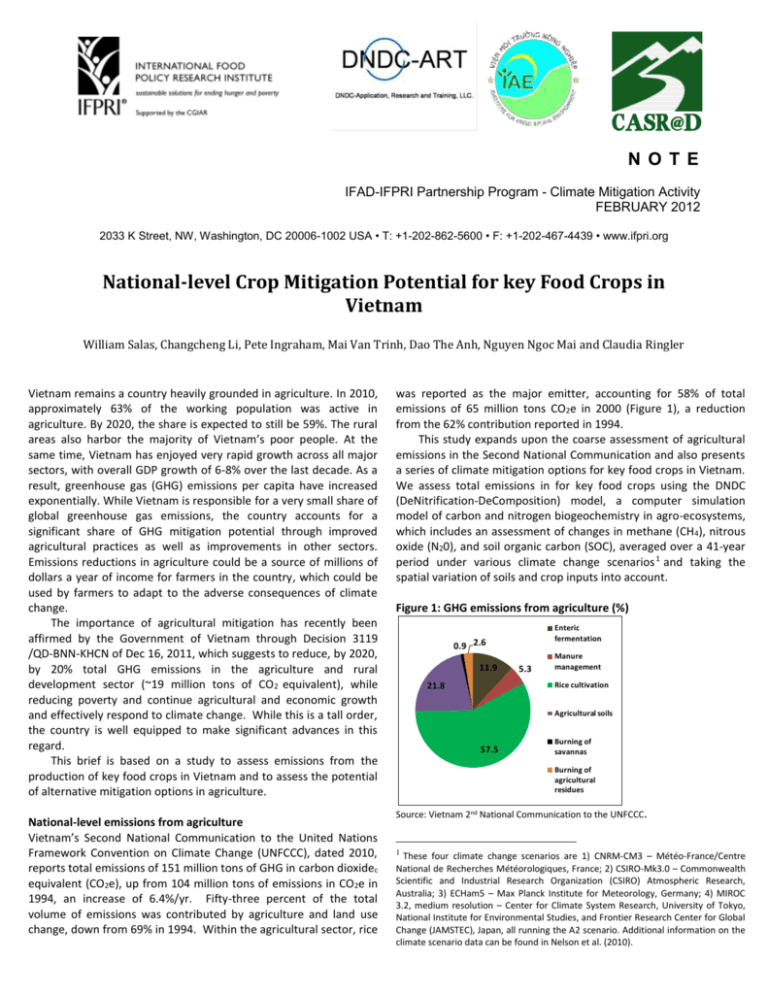
change, down from 69% in 1994. Within the agricultural sector, rice
was reported as the major emitter, accounting for 58% of total
emissions of 65 million tons CO2e in 2000 (Figure 1), a reduction
from the 62% contribution reported in 1994.
This study expands upon the coarse assessment of agricultural
emissions in the Second National Communication and also presents
a series of climate mitigation options for key food crops in Vietnam.
We assess total emissions in for key food crops using the DNDC
(DeNitrification-DeComposition) model, a computer simulation
model of carbon and nitrogen biogeochemistry in agro-ecosystems,
which includes an assessment of changes in methane (CH 4), nitrous
oxide (N20), and soil organic carbon (SOC), averaged over a 41-year
period under various climate change scenarios 1 and taking the
spatial variation of soils and crop inputs into account.
Figure 1: GHG emissions from agriculture (%)
Enteric
fermentation
0.9 2.6
11.9
5.3
Manure
management
Rice cultivation
21.8
Agricultural soils
57.5
Burning of
savannas
Burning of
agricultural
residues
Source: Vietnam 2nd National Communication to the UNFCCC.
1
These four climate change scenarios are 1) CNRM-CM3 – Météo-France/Centre
National de Recherches Météorologiques, France; 2) CSIRO-Mk3.0 – Commonwealth
Scientific and Industrial Research Organization (CSIRO) Atmospheric Research,
Australia; 3) ECHam5 – Max Planck Institute for Meteorology, Germany; 4) MIROC
3.2, medium resolution – Center for Climate System Research, University of Tokyo,
National Institute for Environmental Studies, and Frontier Research Center for Global
Change (JAMSTEC), Japan, all running the A2 scenario. Additional information on the
climate scenario data can be found in Nelson et al. (2010).
Results for Crop-level Emissions
Across the four scenarios, total food crop emissions vary from 95 to
98 million tons of CO2e. Results for the CNRM Global Circulation
Model fall in the middle of that range. Under this scenario,
emissions from food crops add to 97 million tons of CO2e, 2.6 times
the level reported in the Second National Communication for 2000.
As expected emissions were largest for rice (77 million tons of
CO2e), followed by sugarcane (9 million tons of CO2e) (Table 1).
Emissions per ha are highest for sugarcane, followed by rice.
For all mitigation scenarios we assume a 100% adoption across the
crop area and report 41-year average results under the CNRM A2
climate change scenario. Figures 2 and 3 present changes in GHG
emissions and rice yields, and changes in emissions for upland
crops, respectively. For rice, dry seeding and AWD provide the
largest emission reduction benefits but yields also slightly decline.
Yields increase under ASF, NUE and straw manure. For upland
crops, NUE is beneficial for most crops and yields changes (not
shown) are always positive. Here, ASF increases emissions
considerably, and biochar leads to small emission increases.
Table 1: Emissions per ha and total emissions, CO2e, food crops,
Vietnam
Figure 2: Changes in GHG emissions and yields, rice, alternative
mitigation strategies, compared to baseline (CNRM scenario) (%)
Ton CO2e/ha
million tons of CO2e
yield change (line)
emissions change (column)
Rice
20
77.32
4
40
Sugarcane
28
8.68
2
20
7
3.36
Cassava
12
2.96
0
0
Peanut
10
2.39
-2
-20
Soybean
17
2.17
-4
-40
Source: Authors.
-6
-60
The main GHG sources and sinks include change in SOC, CH4and N20.
According to our results, SOC is a net sink for all key food crops.
Methane is only a major source for rice. Nitrous oxide emissions
(converted into ton/kg CO2e) is a major emissions source for
sugarcane, followed by soybean and cassava and a minor source for
rice.
-8
-80
-10
-100
Maize
Total
96.88
Alternative Mitigation Options
For rice, we assessed the following alternative agricultural
mitigation options: 1) Ammonium sulfate fertilizers (ASF), 2)
Alternate wet and dry irrigation (AWD), 3) Biochar, 4) Compost
manure, 5) Dry seeding, 6) Improved Nutrient Use Efficiency (NUE)
and 7) Straw Manure. Table 2 presents an overview on the
implementation of these alternative management practices with
DNDC.
Source: Authors.
Figure 3: Changes in GHG emissions for upland crops, alternative
mitigation strategies, compared to baseline (CNRM scenario) (%)
30
25
20
15
10
5
0
-5
Table 2: Alternative Agricultural Mitigation Options
Intervention
Ammonium Sulfate
Fertilizer (ASF)
Alternate Wetting &
Drying (AWD)
Biochar
Compost Manure
Dry Seeding
N-use Efficient
Variety (NUE)
Straw Manure
Source: Authors.
Change from Baseline Management
All fertilizer N applied as Ammonium Sulfate
Flood for 3 days every 7 days (3 days flooded, 4 days
drained rotation)
Apply 5,769 kg/ha (3000 kgC/ha) biochar (C:N = 219) at
planting in addition to farmyard manure
Exchange farmyard manure for compost (C:N = 30)
Flood 5 days after planting; flood for approximately 30
days, AWD for approximately 30 days, then flood for
approximately 21 days
Plant tissue C/N (root, stem and leaf, and grain)
increased 25%
Exchange farmyard manure for straw (C:N = 50)
Peanut
Soybean
Maize
Cassava
Sugarcane
-10
-15
Ammonium Sulfate Fertilizer
Biochar
N-use Efficient Variety
Source: Authors.
Table 3: Emission Reduction Potential by crop and mitigation
option
Rice
Peanut
Soybean
Maize
Cassava
Sugarcane
Source: Authors.
Emission Reduction
Potential
81.2
na
8.6
10.4
4.3
8.0
Mitigation Option
AWD or NUE
na
NUE
NUE
NUE
NUE
Costs and Benefits of Implementing Alternative Mitigation Options
Figure 4: Rice AWD: Potential for emission reductions (million tons
CO2e) and income from carbon payments ($/CO2e/ha)
$/ha payment for emission reduction
800
700
600
500
400
300
200
100
0
Tra Vinh
Soc Trang
Bac Lieu
Hau Giang
Ca Mau
Kien Giang
Tien Giang
Ben Tre
Can Tho
Hai Duong
Vinh Long
Ho Chi Minh …
Long An
Dong Thap
Ba Ria-Vung …
An Giang
Binh Phuoc
Hai Phong
Bac Ninh
Dong Nai
Phu Yen
Dac Nong
Binh Dinh
Tay Ninh
Quang Ngai
Quang Nam
Binh Thuan
Khanh Hoa
Binh Duong
Ninh Thuan
Gia Lai
Da Nang
Dak Lak
Lam Dong
Ha Tinh
Kon Tum
Thanh Hoa
Ninh Binh
Ha Tay
Nam Dinh
Hung Yen
Thai Binh
Nghe An
Ha Nam
Ha Noi
Lai Chau
Thua Thien -…
Cao Bang
Quang Binh
Quang Tri
Ha Giang
Dien Bien
Lao Cai
Bac Kan
Son La
Quang Ninh
Vinh Phuc
Yen Bai
Lang Son
Tuyen Quang
Hoa Binh
Bac Giang
Thai Nguyen
Phu Tho
from carbon markets for AWD in rice across the provinces in
Vietnam as well as the total mitigation potential for AWD for each
province. The figure shows that per ha mitigation potential and
thus carbon payments per hectare is lowest in the Mekong Delta
(Tra Vinh, Soc Trang and Bac Lieu) with payments of $12-13 per
hectare rice for AWD and largest in the highland provinces of Thai
Nguyen and Phu Tho with potential payments of $670 and $700. On
the other hand, total mitigation potential for AWD rice is largest in
Bac Giang, Nghe An and Thai Binh provinces and smallest in Dac
Nong.
Given that payments in the major rice-producing areas of
Vietnam would likely be rather modest, it is important that
mitigation activities do not only not compromise crop yields, but
also do not reduce net farm profits, at least not beyond potential
benefits from mitigation.
For Vietnam as a whole, we found that AWD could increase
annual net farm incomes across Vietnam by $41 million from yield
improvements and by a further $627 million from carbon payments
(see Figure 5). Higher net profits from agricultural production are
due to reduced irrigation water applications under this mitigation
option, which more than compensate for slightly lower yields.
Carbon benefits are similarly large for dry seeding ($628 million),
but production benefits are lower (by $247 million) due to lower
crop yields despite cost savings from reduced irrigation applications.
For ammonium sulfate, annual net returns are $431 million for
changes in production and $43 million for changes in emissions.
Applying ammonium sulfate instead of urea results in higher
production costs (40%-increase in fertilizer costs), which is more
than compensated for by higher crop yields.
Figure 5: Changes in net profit (from both agricultural production
and carbon payments), alternative mitigation options, Vietnam
rice area, compared to baseline
Change in benefit from carbon market
Change in benefit from production
2,000
US$ million
1,500
1,000
500
0
AWD
Ammonium
sulfate
Biochar
Compost
manure
Dry seeding
-500
Source: Authors.
5.0
4.0
4.5
3.5
3.0
2.0
2.5
1.5
1.0
0.0
0.5
Total emission reduction (million ton CO2e)
Source: Authors.
Payments from carbon markets for crop-level mitigation are
generally small (for example, $10 per ton carbon sequestered or
emissions reduced). Figure 4 presents the potential per ha payment
Finally, biochar significantly increases crop yields over the 41-year
modeling period, particularly in the Mekong River Delta. Compost
manure is cheaper than farmyard manure but yield declines more
than outweigh benefits from lower production costs. Annual carbon
market benefits of $108 million are insufficient to make up for
income declines from lower production.
No data was available on the increase in net benefits for
increased nutrient-use efficiency, as we assumed this to be achieved
through a new plant variety that is not yet available on the market.
However, the assumption is that increased NUE would reduce costs
through reduced fertilizer application requirements, which is of
great benefit not only to the environment, but also to farmers that
face increasing fertilizer prices as a result of growing oil scarcity.
Carbon market benefits from NUE are estimated at a low $6 million
per year.
increasingly scarce. Similarly, dry-seeding can reduce labor costs
and save irrigation water while reducing GHG emissions.
Figure 6: Poverty concentration (number of people below $2/day
and emissions from staple crops (including all 6 crops studied),
Vietnam
Emissions, Mitigation and Poverty Alleviation
Targeting agricultural mitigation benefits to smallholder farmers
requires to identify those areas that harbor the highest emissions
and highest mitigation potential as well as the largest poverty
concentration.
Figure 6 presents the concentration of poverty and staple crop
emissions across Vietnam. Poverty (number of poor per km2) is
concentrated in the Mekong and Red River Deltas. These same
areas also have the highest GHG emissions, chiefly from rice
production. We also find that the potential for crop-based
mitigation is largest in these two deltas, with small nuances
depending on the mitigation option chosen.
Source: Authors.
Conclusions and Policy Implications
While Vietnam’s emissions are relatively low in a global context,
they are growing rapidly and will likely triple by 2030 unless
significant mitigation options are undertaken.
Agriculture contributes most to GHG emissions in Vietnam, but
the sector will soon be outpaced by emission increases in the
energy sector. Nevertheless, agriculture has an important role to
play in reducing emissions, particularly if smallholder farmers can
obtain economic benefits from implementing emission reductions
by linking to global carbon markets.
Of particular importance, most emission reduction options can
be applied at little cost, lead only to small yield reductions or actual
yield increases, and can help farmers adapt to climate change. AWD,
for example, can save irrigation water and energy use through
reduced pumping; resources that are expected to become
However, the crop-level mitigation potential differs by subregion, mitigation option and crop. While our results need further
study and analysis, they provide a first glimpse at the great variation
across the provinces in Vietnam.
We find that overall the mitigation potential is largest with rice
and largest in those areas that harbor most of the poor people ($2
PPP poverty) in the country.
The importance of agricultural mitigation for Vietnam has been
affirmed by the Government Decision 3119 /QD-BNN-KHCN of Dec
16, 2011, which expressly works toward reducing agricultural
emissions while enhancing economic growth and reducing poverty.
Our analysis has shown that the potential for mitigation is
significant but needs careful assessment regarding yield, production
and other environmental impacts.
William Salas, Changcheng Li, and Pete Ingraham are Vice-President and President at DNDC Applications, Research
and Training and research scientist at Applied GeoSolutions, respectively; Mai Van Trinh is Vice Director at the
Institute for Agricultural Environment; Dao The Anh and Nguyen Ngoc Mai are Director and Senior Researcher,
respectively at Centre for Agrarian Systems Research and Development (CASRAD), Vietnam Academy of Agricultural
Sciences, and Claudia Ringler is a Senior Research Fellow, International Food Policy Research Institute
This project note has been prepared as an output for the “Strategic Partnership to Develop Innovative Policies on
Climate Change Mitigation and Market Access” and has not been peer reviewed. Any opinions stated herein are those of
the authors and do not necessarily reflect the policies or opinions of IFPRI.
Copyright © 2012. International Food Policy Research Institute. All rights reserved. To obtain permission to reprint,
contact the Communications Division at ifpri-copyright@cgiar.org.

