Supplementary information for
advertisement
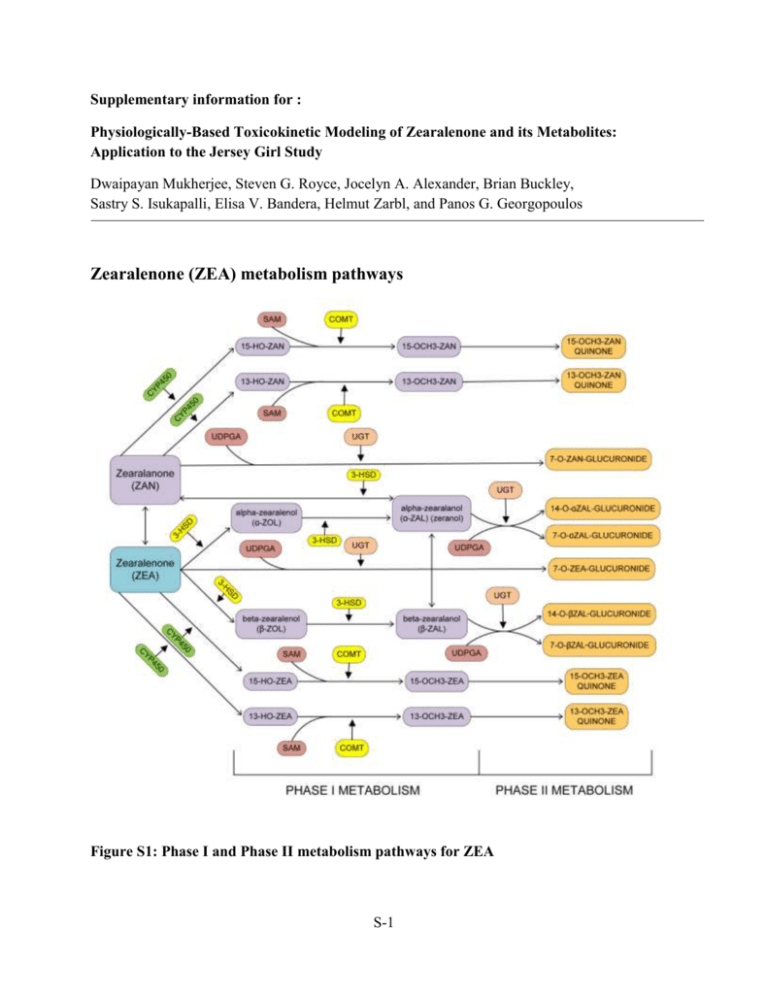
Supplementary information for : Physiologically-Based Toxicokinetic Modeling of Zearalenone and its Metabolites: Application to the Jersey Girl Study Dwaipayan Mukherjee, Steven G. Royce, Jocelyn A. Alexander, Brian Buckley, Sastry S. Isukapalli, Elisa V. Bandera, Helmut Zarbl, and Panos G. Georgopoulos Zearalenone (ZEA) metabolism pathways Figure S1: Phase I and Phase II metabolism pathways for ZEA S-1 Estimation of partition coefficients Tissue : Plasma partition coefficients, Pt:p are estimated according to Poulin & Theil(1) as: Po:w Vnlt 0.3V pht Vwt 0.7V pht fu Pt: p p Po:w Vnlp 0.3V php Vwp 0.7V php fut Po:w = octanol:water partition coefficient (for non-adipose tissues) = olive oil:water partition coefficient (for adipose tissue) fup = unbound fraction of chemical in plasma fut = unbound fraction of chemical in tissue ( = 1 for adipose tissue) Vnl = fractional volume of neutral lipids Vph = fractional volume of phospholipids Vw = fractional volume of water Table S1. Tissue composition data for estimation of partition coefficients Tissues Water (Vw) Neutral Lipids (Vnl) Phospholipids (Vph) Adipose 0.12 0.853 0.002 Brain 0.788 0.0392 0.0533 Small Intestine 0.749 0.0292 0.0138 Heart 0.779 0.014 0.0118 Kidney 0.771 0.0123 0.0284 Liver 0.705 0.0138 0.0303 Lung 0.79 0.0219 0.014 Muscle 0.756 0.01 0.009 Spleen 0.771 0.0077 0.0136 Stomach 0.748 0.0292 0.0138 Testes 0.861 0.00033 0.0024 Tissue composition data from Poulin & Theil(1); Data for testes from Davis et al.(2); Data for stomach from Reinoso et al.(3) For zeranol, log PCoc:w = 3.13 (at pH = 7) (Schering-Plough, 1998(4)) So, PCoc:w = 1348.96 fup for zeranol was estimated to be 0.156 using data estimated for zeranol by Haritova et al.(5) fut was calculated using the relation: fut 1 1 fu p 1 0.5 fu p S-2 2 fu p 1 fu p Partition coefficients (PC) for all glucuronides were estimated using the equation described before and the tissue composition data summarized in Table S1.The octanol:water PC for tetrahydro-cannbinol glucuronide ( = 17.4 [Skopp et al (6)]) was used. The olive oil:water PC was estimated using the relation between PCoc:w and PCo:w given by Poulin & Theil(1) for propranolol: PCoc:w 3.2 19.51 PCo:w 0.164 Using the same ratio, PCo:w for GLU = 17.4/19.51 = 0.892 Estimation of physical parameters Fecal excretion parameters in PBTK model for rats and humans (Main data from Migdalof, et al. (7)) Gut Elimination Colon Excretion Feces dmG ka .mG kel .mG , ka absorption constant (Fitzpatrick,1988) dt dmc kel .mG kex .mc , kel elimination constant (to be estimated) dt df kex .mc , kex excretion constant (to be estimated) dt Here we consider the 2 chemicals ZOL and GLU independently. We assume no interconversion between them in the gut and colon and so each chemical is absorbed independently and is also excreted. The absorption constants, ka have been estimated from the percentage of total dose excreted in urine or feces by Fitzpatrick et al.(8). Table S2. Fecal amounts of ZEA and its metabolites for rats Time (hr.) Feces (% dose) GLU* ZOL* (cumulative) 12 0.39 0.312 0.0176 24 28.49 22.792 1.2821 48 64.69 51.752 2.9111 72 71.55 57.24 3.2198 96 73.88 59.104 3.3246 *Calculated from percentages (80% GLU, 15.5% ZEA, 4.5% ZOL) reported by Fitzpatrick et al. (8) S-3 The above set of differential equations has been solved by changing parameters and comparing the results with the above tabulated measurement results. The parameter values have been optimized using the MATLAB subroutine fminsearchbnd. The estimated parameters are summarized in the table below. For ZEA, however, we have only the 96 hour value as reported by Fitzpatrick et al.(8). Comparing with that single value, and using the parameters of ZOL as first guesses, we get: Table S3. Parameter values for fecal excretion for rats Parameter ZEA ZOL Elimination from colon 0.0034 0.0003 Excretion in feces 0.0013 0.0002 GLU 0.0113 0.0003 For humans, the same method is applied using human data from Fitzpatrick et al.(8) Table S4. Fecal amounts of ZEA and its metabolites for humans Time (hr.) Feces (% dose) ZOL* GLU* (cumulative) 24 0.02 0.0009 0.016 48 10.09 0.45405 8.072 72 16.22 0.7299 12.976 96 20.83 0.93735 16.664 120 22.75 1.02375 18.2 *Calculated from percentages (80% GLU, 15.5% ZEA, 4.5% ZOL) reported by Fitzpatrick et al.(8) The above set of differential equations has been solved by changing parameters and comparing the results with the above tabulated measurement results. The parameter values have been optimized using the MATLAB function fminsearchbnd. The estimated parameters are summarized in the table below. For ZEA however, we have assumed the same value as estimated for the rat, because of absence of human data. Table S5. Parameter values for fecal excretion for humans Parameter ZEA ZOL Elimination from colon 0.0034 6.375×10⁻⁵ Excretion in feces 0.0013 2.418×10⁻⁴ S-4 GLU 0.0142 4.088×10⁻⁵ Biliary recirculation parameter in PBTK model for rats and humans (Main data from Migdalof, et al.(7)) Blood Partition Liver Rate constant Bile Cliv Cblood .PCliv:blood dmb kb .Cliv .Vliv , kb biliary recirculation constant dt Table S6. Blood concentrations in rats Time (hr.) Blood (conc./dose) GLU* ZOL* 0.5 0.07 0.0559 0.0141 1 0.034 0.0271 0.0069 2 0.025 0.02 0.005 4 0.024 0.0192 0.0048 8 0.018 0.0144 0.0036 12 0.013 0.0104 0.0026 24 0.011 0.0088 0.0022 *Migdalof et al(9), reports about 80% of the concentration in blood and urine to be conjugated Results from curve-fitting (blood concentration): ZOL: Cblood (0.0082)t 0.434 (% dose, hr.) GLU: Cblood (0.0328)t 0.434 (% dose, hr.) Table S7. Liver – Blood partition coefficients for rats ZEA ZOL GLU 4.56 5.5702 0.6562 Converting blood concentration to liver concentration using partition coefficients: ZOL: Cliv (0.0457)t 0.434 (%dose, hr.) GLU: Cliv (0.0215)t 0.434 (%dose, hr.) Table S8. Biliary recirculation amounts in rats Time (hr.) Bile (% dose) GLU* ZOL* 2 8.5 6.8 0.425 4 13.8 11.04 0.69 8 26.2 20.96 1.31 12 35.8 28.64 1.79 24 70.7 56.56 3.535 * Assuming 80% GLU and 5% ZOL according to Migdalof et al(7). Results from curve-fitting: S-5 ZOL: (% dose, hr.) m (0.1441)t 0.0906 dm dt 0.1441 GLU: (%dose, hr.) m (2.3061)t 1.4492 dm dt 2.3061 dm 1 1 kb . b , kb biliary recirculation constant Cliv .Vliv dt 100 The value of the filtration rate constant will be a function of time. We find the average over time for each chemical. The values are presented in the table below. The value of the parameter for ZEA is estimated from Shin et al.(10), where they have estimated 2 parameters for biliary recirculation and biliary elimination. We have added these 2 parameters as we have considered both these processes together in bile flow in our PBTK model. The average amount of ZEA in the liver as predicted by the Shin model is about 0.5 ng/g. We have used that information to get the fraction of ZEA recirculated into bile per min. Table S9. Final estimated values of kb for rats ZEA (min-1) ZOL (min-1) GLU (min-1) *0.00086 0.0083 0.283 *after scaling with body weight Due to absence of biliary data in humans, we have assumed the biliary parameters calculated in rats for humans. The parameter for ZEA as estimated from Shin et al.(10) was scaled by body weight and is different due to a different body weight for humans (70 kg). Table S10. Final estimated values of kb for humans ZEA ZOL GLU *0.0585 0.0083 0.283 *after scaling with body weight S-6 Urinary filtration parameters in PBTK model for rats and humans (Main data from Migdalof, et al. (7)) Blood Partition Kidney Rate constant Urine Ckid Cblood .PCkid :blood dmu k f .Ckid .Vkid , k f urinary filtration constant dt Results from curve-fitting (blood concentration) as shown in last section: ZOL: Cblood (0.0082)t 0.434 (% dose, hr.) GLU: Cblood (0.0328)t 0.434 (% dose, hr.) Table S11. Kidney – Blood partition coefficients in rats ZEA ZOL GLU 5.55 5.0894 0.6729 Converting blood concentration to kidney concentration using partition coefficients: ZOL: Ckid (0.0417)t 0.434 (% dose, hr.) GLU: Ckid (0.022)t 0.434 (% dose, hr.) Table S12. Urinary amounts in rats Time (hr.) Urine (% dose) (cum.) GLU* ZOL* 12 2.83 2.023 0.0708 36 5.21 3.725 0.1303 48 6.79 4.855 0.1698 72 7.39 5.284 0.1848 96 7.53 5.384 0.1883 *based on 71.5% GLU and 2.5% ZOL in rat urine according to Mirocha et al. (11) Results from curve-fitting: ZOL: (% dose, hr.) m (2 105 )t 2 (0.004)t 0.0256 dm dt (4 105 )t 0.004 GLU: (% dose, hr.) m (7 104 )t 2 (0.1132)t 0.7308 dm dt (1.4 103 )t 0.1132 S-7 kf dm 1 1 . u , k f urinary filtration constant Ckid .Vkid dt 100 The value of the filtration rate constant will be a function of time. We find the average over time for each chemical. The values are presented in Table S15. For ZEA, we use data from Mirocha et al. (11). They do not report blood concentrations, so we used the blood concentration data from Shin et al.(10) extrapolating for the dose used by Mirocha et al. (11), assuming linear dose-response. They have data only for the entire urine collected after 96 hours. So we try optimizing the urinary parameter to match the total urinary excretion after 96 hrs. Table S13. Kidney-blood partitioning of chemicals in rats Time Blood conc.(ng/ml) Estimated blood conc. (ng/ml) for (hr.) (Shin et al.) Mirocha et al. (dose = 5mg) (dose = 2mg) 0.08 1.5 3.75 0.17 1.8 4.5 0.25 1.9 4.75 0.5 1 2.5 1 0.8 2 1.5 0.7 1.75 2 0.8 2 3 1.85 4.625 6 1.25 3.125 12 0.75 1.875 24 0.4 1 96* 0.15* 0.385* *extrapolated to 96 hrs. dmu k f .Ckid .Vkid dt Estimated kidney conc. (k:b partition coeff. = 5.55) 20.8125 24.975 26.3625 13.875 11.1 9.7125 11.1 25.6688 17.3438 10.4063 5.55 2.134* 96 mu k f .Ckid .Vkid .dt 0 We can find the total amount of urine excreted in 96 hrs. by integrating as shown by the above equation. The integral may be estimated by finding the area under the curve defined by the above data points. Mirocha et al.(11) estimates the final urinary concentration to be 13.7 µg/ml after 96 hrs. of collection. It is estimated that in 96 hrs the total amount of urine produced by a rat is about 96 ml (Rat Phenome Database (12)). So total ZEA obtained in urine after 96 hrs. = 1.315 mg. We optimize the parameter so that the estimated total excretion of ZEA matches the experimentally determined value by Mirocha et al. (11). S-8 Table S14. Final values of the urinary filtration parameter in rats ZEA ZOL GLU 0.00063 0.0006 0.033 For humans, we use data from Migdalof et al.(7) Table S15. Blood concentrations in humans Time (hr.) Blood ZOL* GLU* (conc./dose) 0.5 0.104 0.00104 0.10296 1 0.28 0.0028 0.2772 2 0.232 0.00232 0.22968 3 0.168 0.00168 0.16632 4 0.167 0.00167 0.16533 6 0.15 0.0015 0.1485 9 0.161 0.00161 0.15939 12 0.146 0.00146 0.14454 16 0.129 0.00129 0.12771 24 0.086 0.00086 0.08514 36 0.071 0.00071 0.07029 72 0.021 0.00021 0.02079 96 0.014 0.00014 0.01386 (7) *Migdalof et al , reports about 99% of the concentration in blood and urine to be conjugated Results from curve-fitting (blood concentration): ZOL: Cblood (0.0021)e0.03t (% dose, hr.) GLU: Cblood (0.2054)e 0.03t (% dose, hr.) Table S16. Kidney – Blood partition coefficients in humans ZEA ZOL GLU 5.55 5.0894 0.6729 Converting blood concentration to kidney concentration using partition coefficients: ZOL: Ckid (0.0107)e 0.03t (% dose, hr.) GLU: Ckid (0.1382)e0.03t (% dose, hr.) Table S17. Urinary amounts in amounts Time (hr.) Urine (% dose) ZOL* (cumulative) 3 6.41 0.0641 6 13.1 0.131 9 18.44 0.1844 12 20.37 0.2037 24 31.85 0.3185 36 40.62 0.4062 GLU* 6.3459 12.969 18.2556 20.1663 31.5315 40.2138 S-9 48 45.69 0.4569 45.2331 72 51.07 0.5107 50.5593 96 53.46 0.5346 52.9254 120 55.08 0.5508 54.5292 *based on 99% GLU and 1% ZOL in human urine according to Migdalof et al. (7) Results from curve-fitting: ZOL: (% dose, hr.) m (0.1434) log t 0.1204 dm dt (0.1434). 1 t GLU: (% dose, hr.) m (14.198) log t 11.923 dm dt (14.198). 1 t kf dm 1 . u , k f urinary filtration constant Ckid .Vkid dt The value of the filtration rate constant will be a function of time. We find the average over time for each chemical. The values are presented in Table S19. For ZEA, due to non-availability of human feeding experiments, we have assumed the same urinary filtration constant as that estimated for the rat. Table S18. Final values of the urinary filtration parameter for humans ZEA ZOL GLU 0.00063 0.00007 0.0055 Parameter estimation for biochemical parameters Table S19. Activities of various enzymes involved in metabolism of ZEA and its related compounds in humans (Pfeiffer et al.(9)) Parent compound Reaction Enzyme CYP1A2 CYP3A4 UGT1A1 UGT1A3 UGT1A7 UGT1A8 UGT1A9 UGT1A10 UGT2B15 Aromatic hydroxylation ZEN Glucuronidation S-10 Activity (mol/min/mol protein) 12 1 0.231 0.0220 0.0132 0.1595 0.033 0.0055 0.00825 CYP1A2 CYP3A4 UGT1A1 UGT1A3 UGT1A8 UGT1A9 UGT2B7 UGT1A1 UGT1A3 UGT1A8 UGT1A9 UGT1A10 UGT2B4 UGT2B7 UGT1A1 UGT1A3 UGT1A8 UGT1A9 UGT2B4 UGT2B15 CYP1A2 CYP3A4 UGT1A1 UGT1A3 UGT1A4 UGT1A8 UGT1A9 UGT2B4 UGT2B7 UGT2B17 UGT1A1 UGT1A3 UGT1A8 UGT1A9 UGT2B4 UGT2B7 Aromatic hydroxylation α-ZOL Glucuronidation β-ZOL Glucuronidation ZAN Glucuronidation Aromatic hydroxylation α-ZAL Glucuronidation β-ZAL Glucuronidation 16.5 2 0.286 0.099 0.0385 0.011 0.0165 0.165 0.132 0.187 0.0385 0.0055 0.0055 0.0165 0.198 0.077 0.0825 0.0275 0.033 0.044 50 6 0.1595 0.0605 0.0055 0.0165 0.0275 0.011 0.011 0.011 0.066 0.0605 0.0275 0.022 0.011 0.0275 Amount of microsomal proteins = 14.1 mg/g liver (Malekinejad et al.(13)) These values was used to scale the amounts of proteins for the whole liver and the rate constants for the biochemical reactions were estimated by taking a weighted average of the activities of the enzymes listed in Table S21. S-11 Table S20. Michaelis-Menten parameters for intestinal metabolism in humans (Videmann et al.(14)) Compound Vmax (pmol/h) Km (µM) ZEA 8056 579 α-ZOL 208 46.9 β-ZOL 260.5 42.9 ZEA glucuronide 40.1 23.6 α-ZOL glucuronide 53.5 10.8 The exact kinetics of the catalysis of various enzymes involved in the metabolism has not been completely investigated yet. Pfeiffer et al.(9) studied the activities of various CYP enzymes for the aromatic hydroxylation of ZEN and α-ZOL(9) as well as the activities of various UGTs for the glucuronidation of various compounds of the zeranol family(15). Table S21. Equilibrium conversion for glucuronidation (Stevenson et al.(16)) Compound Equilibrium conversion ZEN 0.85 α-ZEL 0.61 β-ZEL 0.61 α-ZAL 0.12 β-ZAL 0.62 ZAN 0.82 S-12 Zearalenone/α-Zeranol contamination in food Table S22. ZEA and α-ZAL (in red) contamination levels in various food groups summarized from the published literature Food Description Location of ZEA/α-ZAL Fraction of References group food source conc. range samples with (µg/kg) +ve detects Starchy EU 0 - 50 45/137 EFSA, 2011(17) SVEG vegetables Legumes Germany 2 - 214 7/45 Schollenberger et LEG al., 2007(18) Other EU 0 - 7.1 67/100 EFSA, 2011(17) OTVEG vegetables EU 0 - 2969 41/100 EFSA, 2011(17) WGRN Whole grains 12 - 50 2/3 Abouzied et al., SWGRN Some whole Michigan, USA grains 1991(19) Refined Michigan, USA 12 - 14 2/17 Abouzied et al., RFGRN grains 1991(19) Popcorn Canada 18 - 19 2/36 Kuiper-Goodman PCON et al., 1987(20) Milk EU 0 - 2.58 164/370 Coffey et al., MILK 2009(21) Beef UK 0.14 - 0.73 1 Dixon et al., 1986(22) BEEF UK 0.1 - 0.81 1 Dixon et al., 1986(22) ORGAN Beef organs Eggs Belgium 3 - 10 7/20 Tangni et al., EGGS 2009(23) S-13 Additional results for PBTK model evaluation in rats Injected multiple dose (8 mg/kg BW) of ZEA once every 3 hours in Sprague-Dawley rats Figure S2: PBTK model predictions of ZEA concentrations (ng/ml) in various tissues of rats compared with in vivo measurements from Shin et al. (10) Figure S3: Venous blood amounts of ZEA in rats after 6 hour constant rate infusion into vein at two different rates (bars represent in vivo results from Shin et al. (10) and circles represent PBTK model predictions) S-14 Additional ZEA and α-ZAL correlation analyses Table S23. Correlations of predicted concentrations in urine for the JGS subjects with number of servings in different food groups Food groups Predicted ZEA conc. in urine Predicted ZAL conc. in urine 2 R p R2 p FRT 0.1129 0.1795 0.1143 0.1739 NSVEG -0.0155 0.8543 -0.0317 0.7072 SVEG -0.0564 0.5032 -0.0447 0.5964 LEG 0.0268 0.751 0.0649 0.4409 OTVEG 0.0757 0.3688 0.042 0.6183 WGRN 0.1499 0.074 0.3963 < 0.0001 SWGRN 0.8679 < 0.0001 0.8635 < 0.0001 RFGRN -0.135 0.108 -0.1754 0.0361 PCON -0.0874 0.2994 -0.1107 0.188 BEEF -0.012 0.8869 -0.0093 0.9125 VEAL -0.0203 0.8102 -0.043 0.6105 LAMB -0.0512 0.5437 -0.0595 0.4801 PORK -0.0775 0.3578 -0.0873 0.3 POULT -0.0587 0.486 -0.0486 0.564 FISH -0.0699 0.4069 -0.0107 0.8992 SHFISH -0.0268 0.7506 -0.032 0.7045 SAUSG -0.0392 0.6417 0.0402 0.6333 ORGAN EGGS 0.3102 0.0002 0.2931 0.0004 NUTS 0.0995 0.2372 0.0542 0.5203 MEATALT 0.019 0.8221 0.0639 0.448 DAIRY 0.06 0.4766 0.0916 0.2764 MILK 0.0985 0.242 0.1715 0.0406 OTMILK 0.0985 0.2417 0.0614 0.4666 NDAIRY 0.0066 0.9376 -0.0116 0.8908 MLSUPP 0.0399 0.6359 0.0408 0.6289 NDMLSUPP -0.1285 0.1261 -0.1626 0.0524 S-15 References (1) (2) (3) (4) (5) (6) (7) (8) (9) (10) (11) (12) (13) (14) (15) (16) Poulin, P.; Theil, F. P., Prediction of Pharmacokinetics prior to In Vivo studies.II. Generic Physiologically Based Pharmacokinetic Models of Drug Disposition. Journal of Pharmaceutical Sciences 2002, 91, (5). Davis, J. T.; Bridges, R. B.; Coniglio, J. G., Changes in lipid composition of the maturing rat testis. Biochem. J. 1966, 98, (1), 342-346. Reinoso, R. F.; Telfer, B. A.; Rowland, M., Tissue water content in rats measured by desiccation. Journal of Pharmacological and Toxicological Methods 1997, 38, (2), 8792. Schering-Plough Environmental Assessment for additional indication for "Improved Feed Efficiency" for Ralgro Magnum ear implants for cattle; Schering-Plough Animal Health Corp.: Union, New Jersey, 1998. Haritova, A. M.; Fink-Gremmels, J., A simulation model for the prediction of tissue:plasma partition coefficients for drug residues in natural casings. The Veterinary Journal 2010, 185, 278-284. Skopp, G.; Poetsch, L.; Mauden, M.; Richter, B., Partition coefficient, blood to plasma ratio, protein binding and short-term stability of 11-nor-delta9-carboxy tetrahydrocannabinol glucuronide. Forensic Science International 2002, 126, 17-23. Migdalof, B. H.; Dugger, H. A.; Heider, J. G.; others, Biotransformation of zeranol: disposition and metabolism in the female rat, rabbit, dog, monkey and man. Xenobiotica 1983, 13, (4), 209-221. Fitzpatrick, D. W.; Arbuckle, L. D.; Hassen, A. M., Zearalenone metabolism and excretion in the rat: Effect of different doses. Journal of Environmental Science and Health 1988, 23, (4), 343-354. Pfeiffer, E.; Hildebrand, A.; Damm, G.; Rapp, A.; others, Aromatic hydroxylation is a major metabolic pathway of the mycoestrogen zearalenone. Molecular Nutrition & Food Research 2009, 53, 1123-1133. Shin, B. S.; Hong, S. H.; others, Physiologically Based Pharmacokinetics of Zearalenone. Journal of Toxicology and Environmental Health 2009, 72, 1395-1405. Mirocha, C. J.; Pathre, S. V.; Robison, T. S., Comparative metabolism of zearalenone and transmission into bovine milk. Food and Cosmetic Toxicology 1981, 19, 25-30. NBRP The National BioResource Project for the Rat in Japan. http://www.anim.med.kyoto-u.ac.jp/nbr/Default.aspx (Accessed 2014 June 20), 2014. Malekinejad, H.; Maas-Bakker, R. F.; Fink-Gremmels, J., Bioactivation of zearalenone by porcine hepatic biotransformation. Journal of Veterinary Research 2005, 36, 799-810. Videmann, B.; Mazallon, M.; others, Metabolism and transfer of the mycotoxin zearalenone in human intestinal Caco-2 cells. Food and Chemical Toxicology 2008, 46, 3279-3286. Pfeiffer, E.; Hildebrand, A.; Mikula, H.; Metzler, M., Glucuronidation of zearalenone, zeranol and four metabolites <I>in vitro</I>: Formation of glucuronides by various microsomes and human UDP-glucuronosyltransferase isoforms. Molecular Nutrition & Food Research 2010, 54, 1-9. Stevenson, D. E.; Hansen, R. P.; Loader, J. I.; Jensen, D. J.; Cooney, J. M.; Wilkins, A. L.; Miles, C. O., Preparative Enzymatic Synthesis of Glucuronides of Zearalenone and S-16 (17) (18) (19) (20) (21) (22) (23) Five of Its Metabolites. Journal of Agricultural and Food Chemistry 2008, 56, (11), 4032-4038. EFSA, Scientific Opinion on the risks for public health related to the presence of zearalenone in food. The EFSA Journal 2011, 9, (6), 2197. Schollenberger, M.; Mueller, H. M.; Ruefle, M.; Terry-Jara, H.; Suchy, S.; Plank, S.; Drochner, W., Natural Occurrence of Fusarium toxins in soy food marketed in Germany. International Journal of Food Microbiology 2007, 113, 142 - 146. Abouzied, M. M.; Azcona, J. I.; Braselton, W. E.; Pestka, J. J., Immunochemical assessment of mycotoxins in 1989 grain foods: evidence for deoxynivalenol (vomitoxin) contamination. Appl Environ Microbiol 1991, 57, (3), 672-7. Kuiper-Goodman, T.; Scott, P. M.; Watanabe, H., Risk assessment of the mycotoxin zearalenone. Regulatory Toxicology & Pharmacology 1987, 7, (3), 253-304. Coffey, R.; Cummins, E.; Ward, S., Exposure assessment of mycotoxins in dairy milk. Food Control 2009, 20, (3), 239-249. Dixon, S. N.; Russell, K. L.; Heitzman, R. J.; Mallinson, C. B., Radioimmunoassay of the anabolic agent zeranol. V: Residues of zeranol in the edible tissues, urine, faeces and bile of steers treated with Ralgro. Journal of Veterinary Pharmacology and Therapeutics 1986, 9, 353-358. Tangni, E. K.; Waegeneers, N.; vanOvermeire, I.; Goeyens, L.; Pussemier, L., Mycotoxin analyses in some home produced eggs in Belgium reveal small contribution to the total daily intake. Science of the Total Environment 2009, 407, (4411 - 4418). S-17
