Lab 5 Report
advertisement
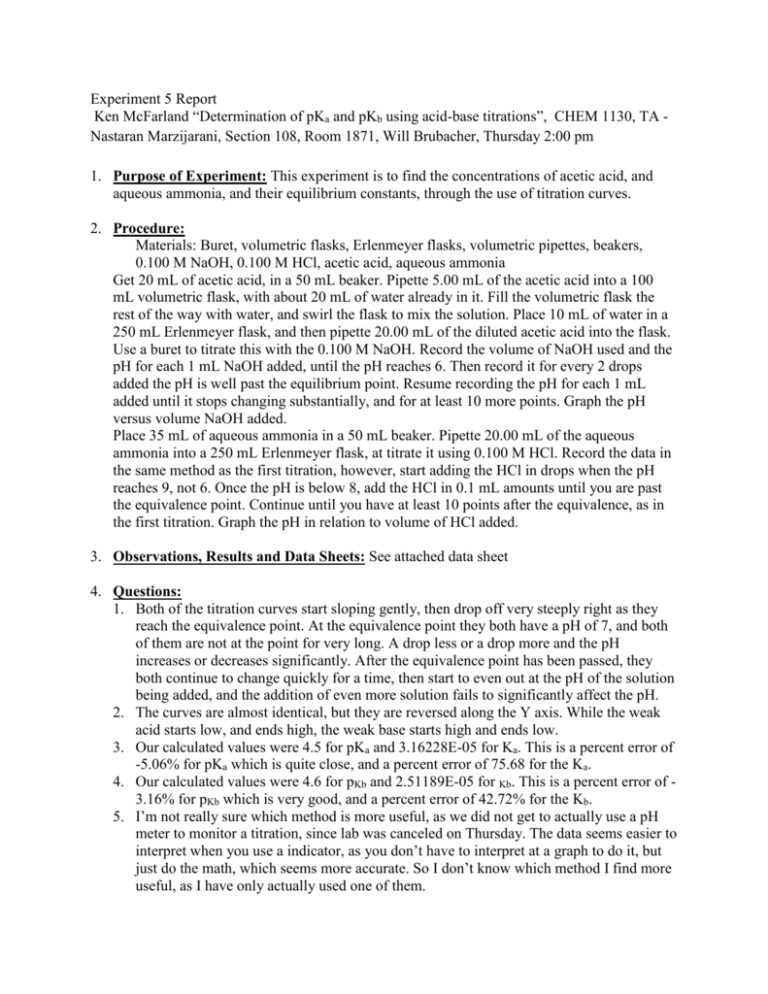
Experiment 5 Report Ken McFarland “Determination of pKa and pKb using acid-base titrations”, CHEM 1130, TA Nastaran Marzijarani, Section 108, Room 1871, Will Brubacher, Thursday 2:00 pm 1. Purpose of Experiment: This experiment is to find the concentrations of acetic acid, and aqueous ammonia, and their equilibrium constants, through the use of titration curves. 2. Procedure: Materials: Buret, volumetric flasks, Erlenmeyer flasks, volumetric pipettes, beakers, 0.100 M NaOH, 0.100 M HCl, acetic acid, aqueous ammonia Get 20 mL of acetic acid, in a 50 mL beaker. Pipette 5.00 mL of the acetic acid into a 100 mL volumetric flask, with about 20 mL of water already in it. Fill the volumetric flask the rest of the way with water, and swirl the flask to mix the solution. Place 10 mL of water in a 250 mL Erlenmeyer flask, and then pipette 20.00 mL of the diluted acetic acid into the flask. Use a buret to titrate this with the 0.100 M NaOH. Record the volume of NaOH used and the pH for each 1 mL NaOH added, until the pH reaches 6. Then record it for every 2 drops added the pH is well past the equilibrium point. Resume recording the pH for each 1 mL added until it stops changing substantially, and for at least 10 more points. Graph the pH versus volume NaOH added. Place 35 mL of aqueous ammonia in a 50 mL beaker. Pipette 20.00 mL of the aqueous ammonia into a 250 mL Erlenmeyer flask, at titrate it using 0.100 M HCl. Record the data in the same method as the first titration, however, start adding the HCl in drops when the pH reaches 9, not 6. Once the pH is below 8, add the HCl in 0.1 mL amounts until you are past the equivalence point. Continue until you have at least 10 points after the equivalence, as in the first titration. Graph the pH in relation to volume of HCl added. 3. Observations, Results and Data Sheets: See attached data sheet 4. Questions: 1. Both of the titration curves start sloping gently, then drop off very steeply right as they reach the equivalence point. At the equivalence point they both have a pH of 7, and both of them are not at the point for very long. A drop less or a drop more and the pH increases or decreases significantly. After the equivalence point has been passed, they both continue to change quickly for a time, then start to even out at the pH of the solution being added, and the addition of even more solution fails to significantly affect the pH. 2. The curves are almost identical, but they are reversed along the Y axis. While the weak acid starts low, and ends high, the weak base starts high and ends low. 3. Our calculated values were 4.5 for pKa and 3.16228E-05 for Ka. This is a percent error of -5.06% for pKa which is quite close, and a percent error of 75.68 for the Ka. 4. Our calculated values were 4.6 for pKb and 2.51189E-05 for Kb. This is a percent error of 3.16% for pKb which is very good, and a percent error of 42.72% for the Kb. 5. I’m not really sure which method is more useful, as we did not get to actually use a pH meter to monitor a titration, since lab was canceled on Thursday. The data seems easier to interpret when you use a indicator, as you don’t have to interpret at a graph to do it, but just do the math, which seems more accurate. So I don’t know which method I find more useful, as I have only actually used one of them.

