Hearing threshold and frequency
differentiation threshold in humans
TEB
04.02
-15
Related Topics
Hearing thresholds curve, frequency differentiation threshold, hearing range.
Principle
The hearing threshold is the minimum sound level of a pure tone that one can perceive. It depends on
the frequency range investigated. The frequency differentiation threshold is the frequency difference between two sounds of the same intensity which can just still be perceived as two different sounds.
Equipment
1 Headphones, stereo
1 Digital function generator
1 Cobra3 Basic Unit, USB
1 Power supply, 12 Volt
1 “Measure” software
1 Shielded BNC cable, l = 30 cm
2 Adapter BNC socket / 4 mm plug pair
PC, Windows® 95 or higher
65974.00
13654.99
12150.50
12151.99
14500.00
07542.10
07542.27
Tasks
Determine the hearing threshold for a number of frequencies in the hearing range of humans and
plot a hearing threshold curve.
Determine the frequency differentiation threshold at different starting frequencies. Plot a curve of the
frequency differentiation threshold.
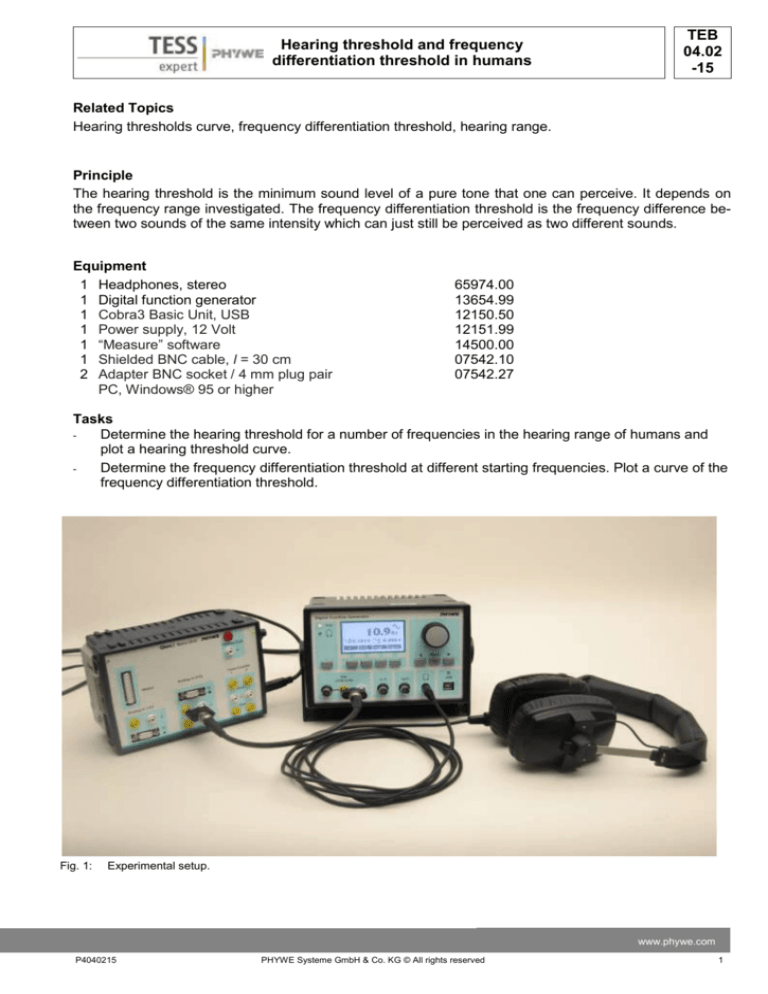
Fig. 1:
Experimental setup.
www.phywe.com
P4040215
PHYWE Systeme GmbH & Co. KG © All rights reserved
1
TEB
04.02
-15
Hearing threshold and frequency
differentiation threshold in humans
Set-up
The experiment is set up (Fig. 1) in a room that is as quiet as possible.
Switch the digital function generator on before you connect the headphones and the Cobra unit. The
Cobra3 unit is connected to a PC through a USB cable.
Change the generator output type to headphones and choose the sine function.
Procedure
Task 1: Hearing Threshold.
Set the signal frequency to 50 Hz and amplitude to zero.
Open the “measure“ software on the PC.
Select the Universal Writer as gauge.
Fig. 2:
-
-
-
-
Measurement parameters.
Set the measurement parameters (see Fig. 2) and
proceed by clicking Continue.
Place the headphones on the head of the test subject. To prevent personal influence, the test subject
must not be able to see the digital display during the
measurement procedure. The measurement should
be repeated several times with the same test subject.
Gradually increase the signal amplitude until the test
subject just hears the sound.
Press the Start measurement button and read off the
amplitude threshold value on the computer screen.
The exact value is given by clicking on the Show extrema or Survey buttons (Fig. 3)
Fig. 3:
2
Amplitude threshold measurement.
PHYWE Systeme GmbH & Co. KG © All rights reserved
P4040215
Hearing threshold and frequency
differentiation threshold in humans
-
TEB
04.02
-15
Decrease the signal amplitude back to zero and click on the red point on the computer screen.
Repeat the measurement of threshold value for frequencies of 100, 200, 500, 1000, 5000, 12000,
13000, 14000 and 15000 Hz. For this purpose the range of Analog in 2 (+/- 0.1 V) and the frequency
(100 kHz) must be readjusted so that the threshold value remains measurable (see Fig. 2)
Task 2: Frequency differentiation threshold
The Cobra3 Basic Unit is not required for this experiment and can be switched off. But apart from
that, the experimental set-up is exactly as for the previous experiment.
Set the signal frequency to 100 Hz. Adjust the amplitude so that the tone is easily audible. Make
sure that the 1000 and 10000 Hz tones at the same amplitude are still easily audible, i.e. are neither
unpleasantly loud nor too faint. If not, readjust the amplitude and recheck all three frequencies for
audibility. The amplitude then remains unchanged for the entire experiment.
Gradually raise and lower the frequency, starting from 100 Hz, until the test subject just detects the
difference, i.e. states “higher tone” or “lower tone”. Repeat each measurement 10 times, i.e. the
subject is offered 5 increases and 5 decreases in frequency, but in an irregular, unpredictable sequence. Record the obtained frequency values. Care must be taken to ensure that the subject does
not see any test values during the experiment.
Repeat the measurement for starting frequencies of 200, 500, 1000, 2000, 5000 and 1.0000 Hz. For
all measurements the amplitude must remain unchanged!
Theory and Evaluation
Task 1: Hearing Threshold.
The hearing threshold is frequency-dependent, i.e. hearing sensitivity is not equally great throughout the
hearing range. The hearing threshold curve is obtained by entering the threshold value for the sound intensity as a function of frequency. Sound intensity is normally entered as a relative value: all threshold
values are related to the threshold value for sound intensity obtained at 1000 Hz. As the range of sound
levels perceived by the ear extends over many powers of ten, the hearing threshold is normally expressed in logarithmic units (decibels: dB).
For evaluation, all amplitude thresholds are therefore first related to the value obtained for 1000 Hz and
converted to dB. This is done using the formula:
L 20 log
Ux
U 1000 dB
(1)
where L is the hearing threshold, U1000 and Ux are
the amplitude threshold values at 1000 kHz and
other frequencies, respectively.
Plot the obtained values, with the hearing threshold
in dB on the y-axis and the logarithm of the frequency on the x-axis (Fig. 4).
The hearing threshold curve falls steadily between
50 and 500 Hz, then remains at a low level to approx. 10000 Hz (with the exception of a brief increase at around 7000 Hz) and then increases again
steeply.
Fig. 4: Hearing threshold curve.
www.phywe.com
P4040215
PHYWE Systeme GmbH & Co. KG © All rights reserved
3
TEB
04.02
-15
Hearing threshold and frequency
differentiation threshold in humans
Task 2: Frequency differentiation threshold
The frequency differentiating threshold is also strongly dependent on the frequency range investigated.
For ease of comparison, the frequency differentiating threshold is normally given not in Hz but as a percentage of the particular starting frequency. For evaluation purposes, the frequency differentiating
threshold values are therefore calculated for each starting frequency (100, 200, 500, 1000, 2000, 5000,
10000 Hz). In addition, for each of the 10 test values the difference between itself and the starting frequency concerned is taken and the mean value calculated. The mean values are converted into percentages of the particular starting frequency. The test values are entered on a system of coordinates,
with the frequency differentiating threshold as a percentage on the x-axis and the starting frequency in
logarithmic units on the y-axis (Fig. 5).
The curve for the frequency differentiating threshold is at a minimum at 1000 Hz. From here the curve
rises relatively steeply on both sides.
Fig. 5:
4
Frequency differentiation threshold curve.
PHYWE Systeme GmbH & Co. KG © All rights reserved
P4040215


