Supplementary information A Combined Multi
advertisement
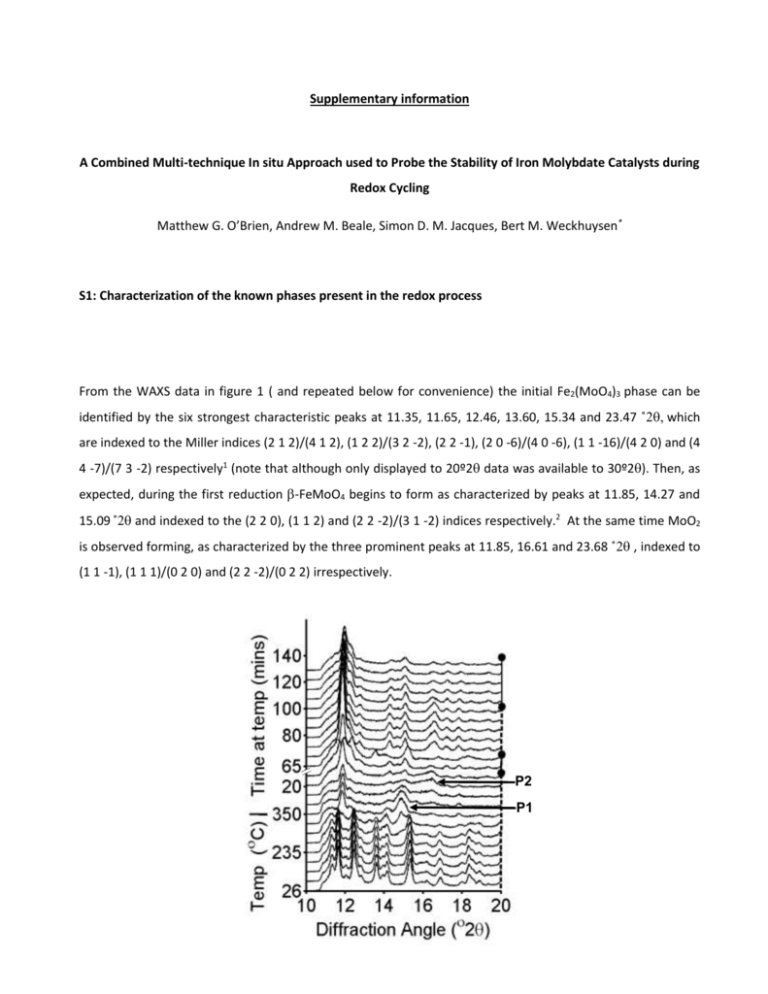
Supplementary information A Combined Multi-technique In situ Approach used to Probe the Stability of Iron Molybdate Catalysts during Redox Cycling Matthew G. O’Brien, Andrew M. Beale, Simon D. M. Jacques, Bert M. Weckhuysen* S1: Characterization of the known phases present in the redox process From the WAXS data in figure 1 ( and repeated below for convenience) the initial Fe2(MoO4)3 phase can be identified by the six strongest characteristic peaks at 11.35, 11.65, 12.46, 13.60, 15.34 and 23.47 ˚which are indexed to the Miller indices (2 1 2)/(4 1 2), (1 2 2)/(3 2 -2), (2 2 -1), (2 0 -6)/(4 0 -6), (1 1 -16)/(4 2 0) and (4 4 -7)/(7 3 -2) respectively1 (note that although only displayed to 20º2 data was available to 30º2). Then, as expected, during the first reduction -FeMoO4 begins to form as characterized by peaks at 11.85, 14.27 and 15.09 ˚and indexed to the (2 2 0), (1 1 2) and (2 2 -2)/(3 1 -2) indices respectively.2 At the same time MoO2 is observed forming, as characterized by the three prominent peaks at 11.85, 16.61 and 23.68 ˚ , indexed to (1 1 -1), (1 1 1)/(0 2 0) and (2 2 -2)/(0 2 2) irrespectively. P2 P1 Figure S1: Reproduction of the WAXS data from figure 1 with the dashed lines representing reduction and solid oxidation. The two unidentified phases P1 and P2 are labeled. S2: Contour plot of the WAXS data Figure S2: A contour plot of the WAS data highlighting the P1 and P2 formation and indicating they are not due to shifts in peak positions of known phases. S3: Initial plot of UV-Vis data Figure S3: The initial UV-Vis scan of the catalyst, indicating the ligand to metal charge transfer band (350 nm) and the unidentified band (463 nm) (a) and a time resolved stack plot the data during the redox cycles. The red arrows represent reducing conditions, the blue arrows oxidizing conditions (b). Note that the two bands at 580 and 608 nm do not change throughout the experiment and therefore most likely do not represent significant components of the catalyst composition and may even be due to some instrument or sample cell induced effect. S4: XAS scans at the beginning and end of reduction Normalised Intensity (a.u.) 1.4 1.2 1.0 2 0.8 1 0.6 0.4 0.2 0.0 20000 20050 20100 Energy (eV) 20150 20200 Figure S4: Comparison of the edge position (1) and first oscillation in the EXAFS (2) at the beginning of reduction (solid line) and at the end of reduction, when phase P2 is present (dashed line). S5: Close up of the formaldehyde GC data during oxidation to reduction switch of gas Ion current (A) 8.0x10 -12 6.0x10 -12 4.0x10 -12 2.0x10 -12 140 142 144 146 Time (min) 148 150 152 Figure S5: The increased formaldehyde production during the oxidation to reduction gas switch reveals tow maxima in output (arrows). S5: XAS Comparison of the WAXS data at the beginning an end of oxidation Intensity (a.u.) 2000 134 min 84 min MoO3 1500 1000 500 0 10 12 14 16 Angle (2) 18 20 Figure S5: The appearance of a peak at 12.36o 2 upon oxidation of the catalyst, indicating the possible formation of MoO3. References (1) Rapposch, M. H.; Anderson, J. B.; Kostiner, E. Inorg. Chem. 1980, 19, 3531. (2) Sleight, A. W.; Chamberland, B. L.; Weiher, J. F. Inorg. Chem. 1968, 7, 1093. (3) Kim, Y. H.; Borry, R. W.; Iglesia, E. Microporous Mesoporous Mat. 2000, 35-6, 495.
