Supplemental File S5. Pathway Maps-Ecosystem
advertisement

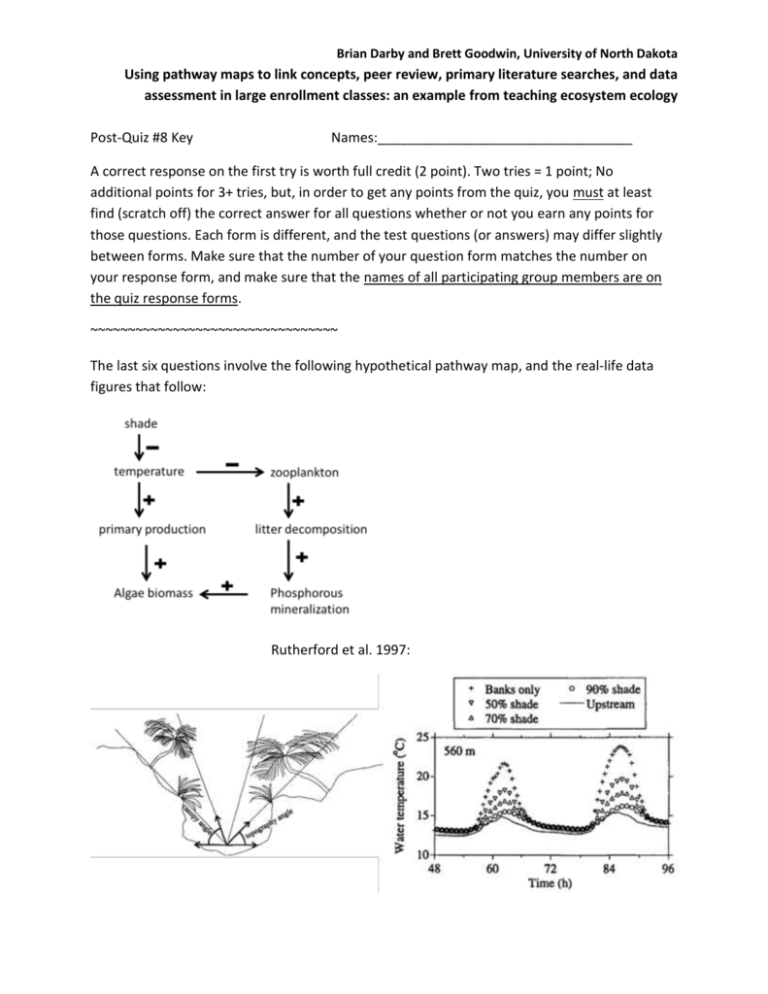
Brian Darby and Brett Goodwin, University of North Dakota Using pathway maps to link concepts, peer review, primary literature searches, and data assessment in large enrollment classes: an example from teaching ecosystem ecology Post-Quiz #8 Key Names:__________________________________ A correct response on the first try is worth full credit (2 point). Two tries = 1 point; No additional points for 3+ tries, but, in order to get any points from the quiz, you must at least find (scratch off) the correct answer for all questions whether or not you earn any points for those questions. Each form is different, and the test questions (or answers) may differ slightly between forms. Make sure that the number of your question form matches the number on your response form, and make sure that the names of all participating group members are on the quiz response forms. ~~~~~~~~~~~~~~~~~~~~~~~~~~~~~~~~~ The last six questions involve the following hypothetical pathway map, and the real-life data figures that follow: Rutherford et al. 1997: Brian Darby and Brett Goodwin, University of North Dakota Using pathway maps to link concepts, peer review, primary literature searches, and data assessment in large enrollment classes: an example from teaching ecosystem ecology Bricaud et al. 2002 Watson et al. 1992: Sanpera et al. 2009: Austin and Vivanco 2006: Austin and Vivanco: k is the rate of mass loss (i.e. higher k = faster decomposition) of litter in a semi-arid grassland ("Fig. 1 Decomposition rates of beech, hazel and ash leaves exposed in single and mixed-species bags. Note that the scales are different on the y-axes for each species") Brian Darby and Brett Goodwin, University of North Dakota Using pathway maps to link concepts, peer review, primary literature searches, and data assessment in large enrollment classes: an example from teaching ecosystem ecology 1) Which of the following is an example of nitrogen mineralization? a. N2 -> NH4 b. Protein -> amino acid c. amino acid -> NH4 d. sucrose -> glucose e. glucose -> CO2 2) Which of the following is an example of carbon mineralization? a. N2 -> NH4 b. Protein -> amino acid c. amino acid -> NH4 d. sucrose -> glucose e. glucose -> CO2 3) In which of the following biomes would you expect the greatest Net Primary Productivity? a. Desert b. Tundra c. Tropical Rain Forest d. Deciduous Forest 4) In which of the following biomes would you expect the greatest decomposition? a. Desert b. Tundra c. Tropical Rain Forest d. Deciduous Forest ~~~ The following questions refer to the pathway map and data figures on the front page~~~ 5) Which data figure best supports the link indicated between shade and temperature? a. Rutherford et al. 1997 b. Bricaud et al. 2002 c. Watson et al. 1992 d. Sanpera et al. 2009 e. Austin and Vivanco 2006 6) Which data figure best supports the link indicated between phosphorous and algal biomass? a. Rutherford et al. 1997 b. Bricaud et al. 2002 c. Watson et al. 1992 Brian Darby and Brett Goodwin, University of North Dakota Using pathway maps to link concepts, peer review, primary literature searches, and data assessment in large enrollment classes: an example from teaching ecosystem ecology d. Sanpera et al. 2009 e. Austin and Vivanco 2006 7) Which link does the Bricaud et al. 2002 data best support? a. shade → temperature b. temperature → primary production c. primary production → algal biomass d. temperature → zooplankton e. temperature → available phosphorous 8) Suppose you questioned whether the Bricaud et al. 2002 data actually supports the link that is indicated in the hypothesized pathway map (and the answer to question #7). What would be another reasonable alternative mechanism for the pattern found by Bricaud et al. 2002? a. sunlight b. chemical runoff c. litter quality d. precipitation e. pesticides 9) What does the Sanpera et al. 2009 data say about the link between zooplankton and litter decomposition? a. The link between zooplankton ad litter decomposition is valid as drawn b. That link may be valid, but it might also depend on the species of litter being decomposed c. The link between zooplankton ad litter decomposition is invalid d. The link between zooplankton ad litter decomposition is valid as drawn for all types of litter e. The species composition of zooplankton depends on the type of litter introduced into the system. 10) The data by Austin and Vivanco (2006) was published in Nature; k is the rate of mass loss (i.e. higher k = faster decomposition) of litter in a semi-arid grassland. What is significant about this data? a. It demonstrates UV-induced photodegredation of litter, which is significant because we usually think of temperature, moisture, and litter quality as significant factors in decomposition. b. It shows that biota were a much more significant factor in decomposition during this experiment than was UV degradation. Brian Darby and Brett Goodwin, University of North Dakota Using pathway maps to link concepts, peer review, primary literature searches, and data assessment in large enrollment classes: an example from teaching ecosystem ecology c. It quantifies both biotic and UV-induced photodegredation of litter, which is significant because most soil ecologists don’t study litter decomposition and rarely publish in Nature. d. It demonstrates that semi-arid soil could be a potential sink for CO2 fixation. e. It demonstrates that UV-B light could be a potential source for CO2 fixation. References for graphs: Austin, A. T. and L. Vivanco. 2006. Plant Litter Decomposition in a Semi-Arid Ecosystem Controlled by Photodegradation. Nature 442:555-558. Bricaud, A., E. Bosc, and D. Antoine. 2002. Algal biomass and sea surface temperature in the Mediterranean Basin: Intercomparison of data from various satellite sensors, and implications for primary production estimates. Remote Sensing of Environment 81:163-178. Rutherford, J., S. Blackett, C. Blackett, L. Saito, and R. J. Davies-Colley. 1997. Predicting the effects of shade on water temperature in small streams. New Zealand Journal of Marine and Freshwater Research 31: 707-721. Sanpera-Calbet, I., A. Lecerf, and E. Chauvet. 2009. Leaf diversity influences in-stream litter decomposition through effects on shredders. Freshwater Biology 54:1671-1682. Watson, S., E. McCauley, and J. A. Downing. 1992. Sigmoid relationships between phosphorous, algal biomass, and algal community structure. Canadian Journal of Fisheries and Aquatic Sciences 49: 2605-2610.


