Causeway Green Primary School Pupil Premium Report July 2015
advertisement
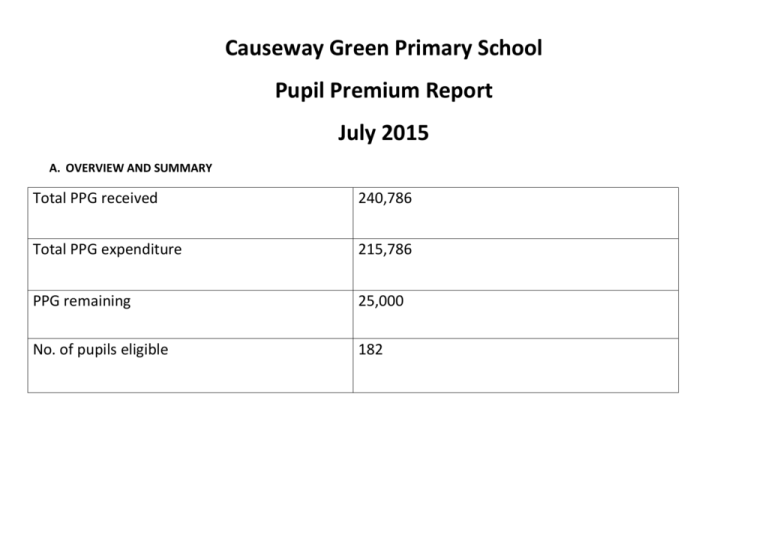
Causeway Green Primary School Pupil Premium Report July 2015 A. OVERVIEW AND SUMMARY Total PPG received 240,786 Total PPG expenditure 215,786 PPG remaining 25,000 No. of pupils eligible 182 Performance of disadvantaged pupils Ever 6 pupils and pupils in care School Comparison JULY 2015 (with National 2015) PP= pupil premium Non PP=non pupil premium KS1 APS READING PP: 15.1 Non PP: 16.8 Gap: 1.7 KS1 APS WRITING PP: 13.4 NPP: 14.6 Gap: 1.2 KS1 APS MATHS PP: 14.9 NPP: 16.7 Gap: 1.8 KS2 APS READING PP: 25.6 NPP: 28.3 Gap: 2.7 KS2 APS WRITING PP: 25.4 NPP: 27.8 Gap: 2.5 KS2 APS MATHS PP: 27.3 NPP: 31.2 Gap: 3.9 Key Stage 1 to Key Stage 2 Value Added 2015 (Progress) 15.2 17.1 1.9 14.0 15.8 1.8 15.1 16.9 1.8 27.6 29.6 2.0 26.6 28.9 2.3 27.3 29.8 2.5 Reading Performance of FSM pupils FSM=Free School Meals Non FSM=non Free School Meals FSM: Non FSM: Gap: FSM: 15Non FSM: Gap: FSM: Non FSM: Gap: FSM: Non FSM: Gap: FSM: Non FSM: Gap: FSM: Non FSM: Gap: School JULY 2015 Comparison (with National 2015) 15.1 16.8 1.7 13.4 14.6 1.2 14.9 16.7 1.8 25.6 28.3 2.7 25.4 27.8 2.4 27.3 31.2 3.9 15.2 17.1 1.9 14.0 15.8 1.8 15.2 16.8 1.6 27.6 29.6 2.0 26.6 28.8 2.2 27.3 29.8 2.5 Writing Maths PP NPP Gap School 100.7 99.8 +0.9 National 99.7 100.0 -0.3 School 100.8 100.0 +0.8 National 99.8 100.0 -0.2 School 101.7 102.2 -0.5 National 99.7 100.1 -0.4 FSM N FSM Gap 100.7 99.8 +0.9 99.7 100.0 -0.3 100.8 100.0 +0.8 99.8 100.0 -0.2 101.7 102.2 -0.5 99.8 100.1 -0.3 Reading: 4 PP pupils did not achieve L4 3 of these were also either SEN/EAL or both Writing: 11 children did not achieve L4 in writing 6 of these were PP All of these apart from 1 child were either EAL or SEN Maths: 7 children did not achieve L4 5 were PP. Of these 2 were below the level of the test-SEN/EAL 1 paper was lost 2 children achieved L3 but were both SEN
