Chapter11
advertisement
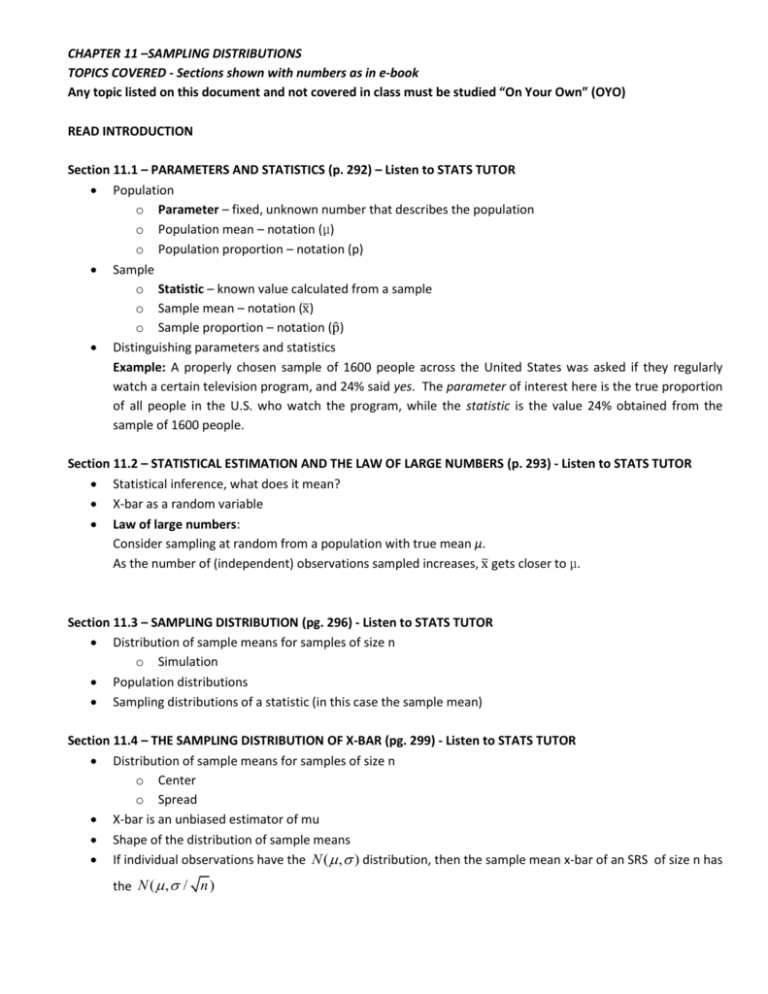
CHAPTER 11 –SAMPLING DISTRIBUTIONS TOPICS COVERED - Sections shown with numbers as in e-book Any topic listed on this document and not covered in class must be studied “On Your Own” (OYO) READ INTRODUCTION Section 11.1 – PARAMETERS AND STATISTICS (p. 292) – Listen to STATS TUTOR Population o Parameter – fixed, unknown number that describes the population o Population mean – notation (μ) o Population proportion – notation (p) Sample o Statistic – known value calculated from a sample o Sample mean – notation (x̅) o Sample proportion – notation (p̂) Distinguishing parameters and statistics Example: A properly chosen sample of 1600 people across the United States was asked if they regularly watch a certain television program, and 24% said yes. The parameter of interest here is the true proportion of all people in the U.S. who watch the program, while the statistic is the value 24% obtained from the sample of 1600 people. Section 11.2 – STATISTICAL ESTIMATION AND THE LAW OF LARGE NUMBERS (p. 293) - Listen to STATS TUTOR Statistical inference, what does it mean? X-bar as a random variable Law of large numbers: Consider sampling at random from a population with true mean µ. As the number of (independent) observations sampled increases, x̅ gets closer to μ. Section 11.3 – SAMPLING DISTRIBUTION (pg. 296) - Listen to STATS TUTOR Distribution of sample means for samples of size n o Simulation Population distributions Sampling distributions of a statistic (in this case the sample mean) Section 11.4 – THE SAMPLING DISTRIBUTION OF X-BAR (pg. 299) - Listen to STATS TUTOR Distribution of sample means for samples of size n o Center o Spread X-bar is an unbiased estimator of mu Shape of the distribution of sample means If individual observations have the N ( , ) distribution, then the sample mean x-bar of an SRS of size n has the N ( , / n ) Section 11.5 – THE CENTRAL LIMIT THEOREM (pg. 301) - Listen to STATS TUTOR Draw an SRS of size n from any population with mean and standard deviation . The Central Limit Theorem says that when n is large, the sampling distribution of the sample means x-bar is approximately normal with x and x n x The standard deviation of x-bar is called the Standard Error of the mean If x is normally distributed, so is the x-bar distribution, regardless of sample size If the sample size is large (n 30) , the x-bar distribution is approximately normally distributed, regardless of the distribution of x. n Summary If x ~ ( , ) and n is large, then x ~ N ( , / n ) regardless of the shape of the distribution of x. How large a sample size n is needed for the x distribution to be close to Normal depends on the population distribution; if x is too far from normal, more observations are required If x is normal, then x is also normal regardless of the sample size n Formula for z-score used when finding probabilities in the distribution of x-bars z = (score – mean) / (std dev of distribution) z = (score – mean) / (standard error) z (x ) ( n ) A parameter in a statistical problem is a number that describes a population, such as the population mean σ To estimate an unknown parameter, use a statistic calculated from a sample, such as the sample mean The law of large numbers states that the actually observed mean outcome the population as the number of observations increases. The population distribution of a variable describes the values of the variable for all individuals in a population. The sampling distribution of a statistic describes the values of the statistic in all possible samples of the same size from the same population. When the sample is an SRS from the population, the mean of the sampling distribution of the sample mean is the same as the population mean . That is, μ is an unbiased estimator of μ. The standard deviation of the sampling distribution of is σ/ foran SRS of size n if the population has standard deviation σ. That is, averages are less variable than individual observations. must approach the mean μ of When the sample is an SRS from a population that has a Normal distribution, the sample mean Normal distribution. Choose an SRS of size n from any population with mean μ and finite standard deviation σ. The central limit theorem states that when n is large the sampling distribution of is approximately Normal. That is, averages are more Normal than individual observations. We can use the N(μ, σ/ distribution alsohas a
