Name: Date: Confidence Interval Practice Examples Proportion
advertisement

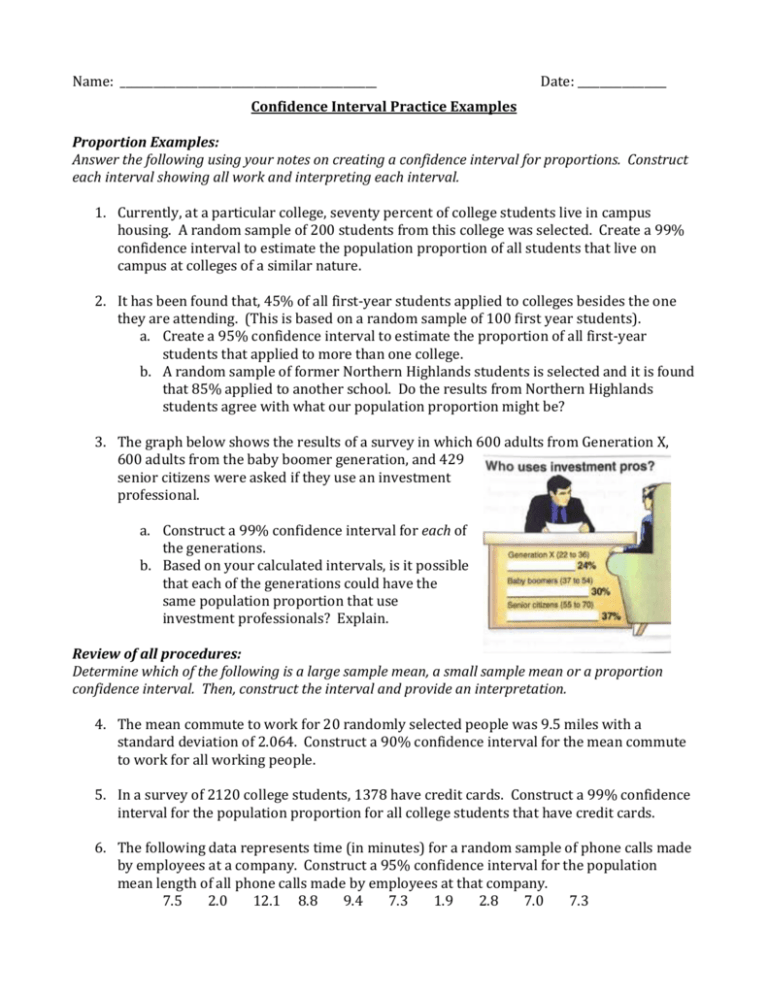
Name: ______________________________________________ Date: ________________ Confidence Interval Practice Examples Proportion Examples: Answer the following using your notes on creating a confidence interval for proportions. Construct each interval showing all work and interpreting each interval. 1. Currently, at a particular college, seventy percent of college students live in campus housing. A random sample of 200 students from this college was selected. Create a 99% confidence interval to estimate the population proportion of all students that live on campus at colleges of a similar nature. 2. It has been found that, 45% of all first-year students applied to colleges besides the one they are attending. (This is based on a random sample of 100 first year students). a. Create a 95% confidence interval to estimate the proportion of all first-year students that applied to more than one college. b. A random sample of former Northern Highlands students is selected and it is found that 85% applied to another school. Do the results from Northern Highlands students agree with what our population proportion might be? 3. The graph below shows the results of a survey in which 600 adults from Generation X, 600 adults from the baby boomer generation, and 429 senior citizens were asked if they use an investment professional. a. Construct a 99% confidence interval for each of the generations. b. Based on your calculated intervals, is it possible that each of the generations could have the same population proportion that use investment professionals? Explain. Review of all procedures: Determine which of the following is a large sample mean, a small sample mean or a proportion confidence interval. Then, construct the interval and provide an interpretation. 4. The mean commute to work for 20 randomly selected people was 9.5 miles with a standard deviation of 2.064. Construct a 90% confidence interval for the mean commute to work for all working people. 5. In a survey of 2120 college students, 1378 have credit cards. Construct a 99% confidence interval for the population proportion for all college students that have credit cards. 6. The following data represents time (in minutes) for a random sample of phone calls made by employees at a company. Construct a 95% confidence interval for the population mean length of all phone calls made by employees at that company. 7.5 2.0 12.1 8.8 9.4 7.3 1.9 2.8 7.0 7.3


