1 - Bekemeyer`s World
advertisement
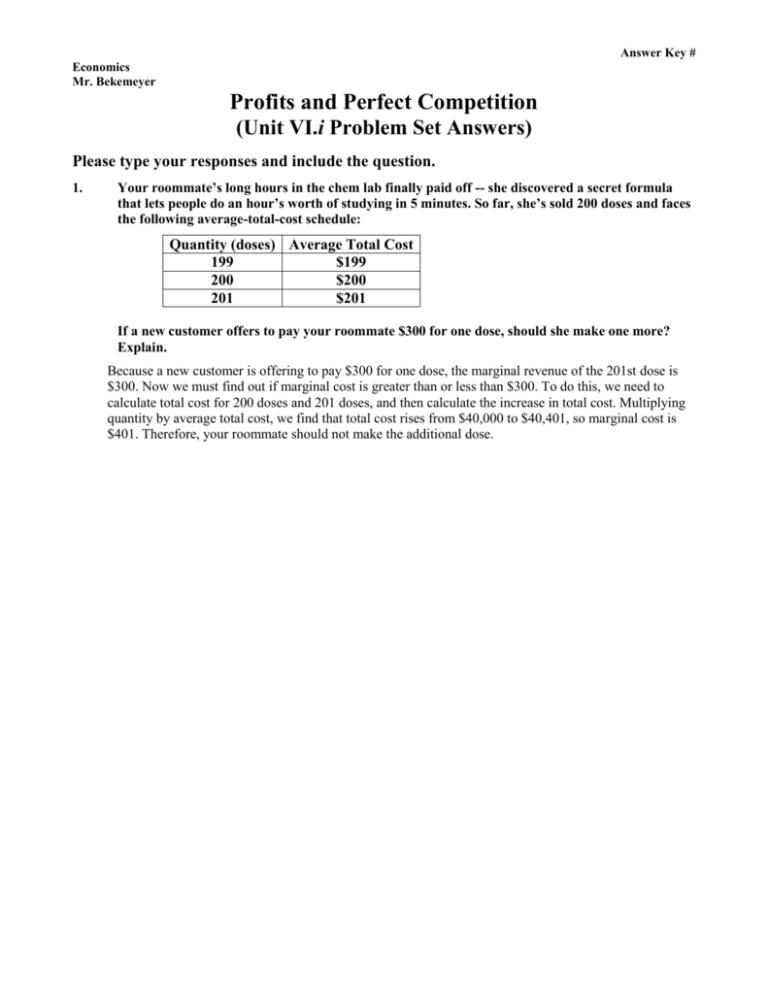
Answer Key # Economics Mr. Bekemeyer Profits and Perfect Competition (Unit VI.i Problem Set Answers) Please type your responses and include the question. 1. Your roommate’s long hours in the chem lab finally paid off -- she discovered a secret formula that lets people do an hour’s worth of studying in 5 minutes. So far, she’s sold 200 doses and faces the following average-total-cost schedule: Quantity (doses) Average Total Cost 199 $199 200 $200 201 $201 If a new customer offers to pay your roommate $300 for one dose, should she make one more? Explain. Because a new customer is offering to pay $300 for one dose, the marginal revenue of the 201st dose is $300. Now we must find out if marginal cost is greater than or less than $300. To do this, we need to calculate total cost for 200 doses and 201 doses, and then calculate the increase in total cost. Multiplying quantity by average total cost, we find that total cost rises from $40,000 to $40,401, so marginal cost is $401. Therefore, your roommate should not make the additional dose. 2. Many small boats are made of fiberglass, which is derived from crude oil. Suppose that the price of oil rises (this causes the minimum ATC to be higher than the new price). a. Using diagrams, show what happens to the cost curves (MC & ATC) of an individual boatmaking firm and to the market supply curve. The rise in the price of crude oil increases production costs for individual firms and thus shifts the industry supply curve up, as shown in the figure below. The typical firm's initial marginal-cost curve is MC1 and its average-total-cost curve is ATC1. In the initial equilibrium, the industry supply curve, S1, intersects the demand curve at price P1, which is equal to the minimum average total cost of the typical firm. Thus, the typical firm earns no economic profit. b. What happens to the profits of boat makers in the short run? What happens to the number of boat makers in the long run? The increase in the price of oil shifts the typical firm's cost curves up to MC2 and ATC2, and shifts the industry supply curve up to S2. The equilibrium price rises from P1 to P2, but the price does not increase by as much as the increase in marginal cost for the firm. As a result, price is less than average total cost for the firm, so profits are negative. In the long run, the negative profits lead some firms to exit the industry. As they do so, the industrysupply curve shifts to the left. This continues until the price rises to equal the minimum point on the firm's average-total-cost curve. The long-run equilibrium occurs with supply curve S3, equilibrium price P3, industry output Q3, and firm's output q3. Thus, in the long run, profits are zero again and there are fewer firms in the industry. 3. You go out to Minneapolis and dine at Murray's Steakhouse. You order the Silver Butter Knife Steak for two and decide to eat it yourself (whew -- 28oz. of beef at $99.00). After eating half of the steak, you realize you are quite full. Your date wants you to finish your dinner because you can’t take it home due to your broken refrigerator and because you’ve “already paid for it.” What should you do? Once you have ordered the dinner, its cost is sunk, so it does not represent an opportunity cost. As a result, the cost of the dinner should not influence your decision about whether to finish it or not. 4. Bob’s lawn-mowing service is a profit-maximizing, competitive firm. Bob mows lawns for $27 each. His total cost each day is $280, of which $30 is a fixed cost. He mows 10 lawns a day. What can you say about Bob’s short run decision regarding shut down and his long-run decision regarding exit? Because Bob’s average total cost is $280/10 = $28, which is greater than the price, he will exit the industry in the long run. Because fixed cost is $30, average variable cost is ($280 − $30)/10 = $25, which is less than price, so Bob will not shut down in the short run. 5. Kate’s Katering provides catered meals, and the catered meals industry is perfectly competitive. Kate’s machinery costs $100 per day and is the only fixed input. Her variable cost consists of the wages paid to the cooks and the food ingredients. The variable cost per day associated with each level of output is given in the accompanying table. Quantity of meals Variable Cost (VC) 0 $0 10 $200 20 $300 30 $480 40 $700 50 $1,000 a. Calculate the total cost, the average variable cost, the average total cost, and the marginal cost for each quantity of output. From Kate’s variable cost (VC), the accompanying table calculates Kate’s total cost (TC), average variable cost (AVC), average total cost (ATC), and marginal cost (MC). b. What is the break-even price? What is the shut-down price? Kate’s break-even price, the minimum average total cost, is $19.33, at an output quantity of 30 meals. Kate’s shut-down price, the minimum average variable cost, is $15, at an output of 20 meals. c. Suppose that the price at which Kate can sell catered meals is $21 per meal. In the short run, will Kate earn a profit? In the short run, should she produce or shut down? When the price is $21, Kate will make a profit: the price is above her break-even price. And since the price is above her shut-down price, Kate should produce in the short run, not shut down. d. Suppose that the price at which Kate can sell catered meals is $17 per meal. In the short run, will Kate earn a profit? In the short run, should she produce or shut down? When the price is $17, Kate will incur a loss: the price is below her break-even price. But since the price is above her shut-down price, Kate should produce in the short run, not shut down. e. Suppose that the price at which Kate can sell catered meals is $13 per meal. In the short run, will Kate earn a profit? In the short run, should she produce or shut down? When the price is $13, Kate would incur a loss if she were to produce: the price is below her break-even price. And since the price is also below her shut-down price, Kate should shut down in the short run. 6. Consider total cost and total revenue given in the following table: Quantity 0 1 2 3 4 5 6 7 Total Cost (TC) $8 $9 $10 $11 $13 $19 $27 $37 Total Revenue (TR) $0 $8 $16 $24 $32 $40 $48 $56 Here is the table showing costs, revenues, and profits: Quantity a. Total Marginal Total Marginal Cost Cost Revenue Revenue Profit 0 $8 --- $0 --- $-8 1 $9 $1 $8 $8 $-1 2 $10 $1 $16 $8 $6 3 $11 $1 $24 $8 $13 4 $13 $2 $32 $8 $19 5 $19 $6 $40 $8 $21 6 $27 $8 $48 $8 $21 7 $37 $10 $56 $8 $19 Calculate profit for each quantity. How much should the firm produce to maximize profit? The firm should produce five or six units to maximize profit. b. Calculate marginal revenue and marginal cost for each quantity. Graph them. (Hint: Put the points between whole numbers. For example, the marginal cost between 2 and 3 should be graphed at 2 ½.) At what quantity do these curves cross? How does this relate to your answer to part (a)? Marginal revenue and marginal cost are graphed below. The curves cross at a quantity between five and six units, yielding the same answer as in Part (a). c. Can you tell whether this firm is in a competitive industry? If so, can you tell whether the industry is in a long-run equilibrium? This industry is competitive because marginal revenue is the same for each quantity. The industry is not in long-run equilibrium, because profit is not equal to zero. 7. From The Wall Street Journal (July 23, 1991): “Since peaking in 1976, per capita beef consumption in the United States has fallen by 28.6 percent… [and] the size of the U.S. cattle herd has shrunk to a 30-year low.” a. Using firm and industry diagrams, show the short-run effect of declining demand for beef. Label the diagram carefully and write out in words all of the changes you can identify. The figure below shows the short-run effect of declining demand for beef. The shift of the industry demand curve from D1 to D2 reduces the quantity from Q1 to Q2 and reduces the price from P1 to P2. This affects the firm, reducing its quantity from q1 to q2. Before the decline in the price, the firm was making zero profits; afterwards, profits are negative, as average total cost exceeds price. b. On a new diagram, show the long-run effect of declining demand for beef. Explain in words. The figure below shows the long-run effect of declining demand for beef. Because firms were losing money in the short run, some firms leave the industry. This shifts the supply curve from S1 to S3. The shift of the supply curve is just enough to increase the price back to its original level, P1. As a result, industry output falls to Q3. For firms that remain in the industry, the rise in the price to P1 returns them to their original situation, producing an output level of q1 and earning zero profits. 8. Suppose the book-printing industry is competitive and begins in a long-run equilibrium. a. Draw a diagram describing the typical firm in the industry. The figure below shows the typical firm in the industry, with average total cost ATC1, marginal cost MC1, and price P1. b. Raider Grafix Printing Company invents a new process that sharply reduces the cost of printing books. What happens to Raider Grafix’s profits and the price of books in the short run when Raider Grafix’s patent prevents other firms from using the new technology? The new process reduces Raider Grafix’s marginal cost to MC2 and its average total cost to ATC2, but the price remains at P1 because other firms cannot use the new process. Thus Raider Grafix earns positive profits. c. What happens in the long run when the patent expires and other firms are free to use the technology? When the patent expires and other firms are free to use the technology, all firms’ average-total-cost curves decline to ATC2, so the market price falls to P3 and firms earn zero profit. 9. The Shanghai Bistro sushi restaurant opens in Hudson, Wisconsin. Initially people are very cautious about eating tiny portions of raw fish, as this is a town where large portions of grilled meat have always been popular. Soon, however, an influential health report warns consumers against grilled meat and suggests that they increase their consumption of fish, especially raw fish. The Shanghai Bistro becomes very popular and its profit increases. a. What will happen to the short-run profit of the Shanghai Bistro? What will happen to the number of sushi restaurants in town in the long run? Will the first sushi restaurant be able to sustain its short-run profit over the long run? Explain your answers. The short-run profit of the Shanghai Bistro will rise, inducing others to open sushi restaurants. The number of sushi restaurants in town will increase. Over time, as the supply of sushi restaurants increases, the equilibrium price of sushi will decrease, lowering the short-run profit of the original sushi restaurant. b. Local steakhouses suffer from the popularity of sushi and start incurring losses. What will happen to the number of steakhouses in town in the long run? Explain your answer. The number of steakhouses in town will decrease in the long run, as owners incur losses and exit from the industry. 10. The market for fertilizer is perfectly competitive. Firms in the market are producing output, but they are currently making economic losses. a. How does the price of fertilizer compare to the average total cost, the average variable cost, and the marginal cost of producing fertilizer? If firms are currently incurring losses, price must be less than average total cost. However, because firms in the industry are currently producing output, price must be greater than average variable cost. If firms are maximizing profits, price must be equal to marginal cost. b. Draw two graphs, side by side, illustrating the present situation for the typical firm and in the market. The present situation is depicted in the figure below. The firm is currently producing q1 units of output at a price of P1. c. Assuming there is no change in demand of the firms’ cost curves, explain what will happen in the long run to the price of fertilizer, marginal cost, average total cost, the quantity supplied by each firm, and the total quantity supplied to the market. The figure above also shows how the market will adjust in the long run. Because firms are incurring losses, there will be exit in this industry. This means that the market supply curve will shift to the left, increasing the price of the product. As the price rises, the remaining firms will increase quantity supplied. Exit will continue until price is equal to minimum average total cost. Average total cost will be lower in the long run than in the short run. The total quantity supplied in the market will fall. 11. Suppose that the U.S. textile industry is competitive, and there is no international trade in textiles. In long-run equilibrium, the price per unit of cloth is $30. a. Describe the equilibrium using graphs for the entire market and for an individual producer. Now suppose that textile producers in other countries are willing to sell large quantities of cloth in the United States for only $25 per unit. The figure below illustrates the situation in the U.S. textile industry. With no international trade, the market is in long-run equilibrium. Supply intersects demand at quantity Q1 and price $30, with a typical firm producing output q1. b. Assuming that U.S. textile producers have large fixed costs, what is the short run effect of an individual producer? What is the short run effect on profits? Illustrate your answer with a graph. The effect of imports at $25 is that the market supply curve follows the old supply curve up to a price of $25, then becomes horizontal at that price. As a result, demand exceeds domestic supply, so the country imports textiles from other countries. The typical domestic firm now reduces its output from q1 to q2, incurring losses, because the large fixed costs imply that average total cost will be much higher than the price. c. What is the long run effect on the number of U.S. firms in the industry? In the long run, domestic firms will be unable to compete with foreign firms because their costs are too high. All the domestic firms will exit the industry and other countries will supply enough to satisfy the entire domestic demand. 12. An industry currently has 100 firms, all of which have fixed costs of $16 and average cost as follows: Quantity Average Variable Cost (AVC) 1 $1 2 $2 3 $3 4 $4 5 $5 6 $6 a. Compute marginal cost and average total cost. The firms' variable cost (VC), total cost (TC), marginal cost (MC), and average total cost (ATC) are shown in the table below: Quantity VC TC MC ATC 1 $1 $17 $1 $17 2 $4 $20 $3 $10 3 $9 $26 $5 $8.67 4 $16 $32 $7 $8 5 $25 $41 $9 $8.20 6 $36 $52 $11 $8.67 b. The price is currently $10. What is the total quantity supplied in the market? If the price is $10, each firm will produce five units, so there will be 5 × 100 = 500 units supplied in the market. c. As this market makes the transition to its long run equilibrium, will the price rise or fall? Will the quantity demanded rise or fall? Will the quantity supplied by each firm rise or fall? At a price of $10 and a quantity supplied of five, each firm is earning a positive profit because price is greater than average total cost. Thus, entry will occur and the price will fall. As price falls, quantity demanded will rise and the quantity supplied by each firm will fall. d. Graph the long run supply curve for this market. The figure below shows the long-run industry supply curve, which will be horizontal at minimum average total cost. 13. A perfectly competitive firm has the following short-run total cost: Quantity Total Cost (TC) 0 $5 1 $10 2 $13 3 $18 4 $25 5 $34 6 $45 Market demand for the firm’s product is given by the following market demand schedule: Price Quantity demanded $12 300 $10 500 $8 800 $6 1,200 $4 1,800 a. Calculate this firm’s marginal cost and, for all output levels except zero, the firm’s average variable cost and average total cost. This firm’s fixed cost is $5, since even when the firm produces no output, it incurs a total cost of $5. The marginal cost (MC), average variable cost (AVC), and average total cost (ATC) are given in the accompanying table. b. There are 100 firms in this industry that all have costs identical to those of this firm. Draw the short-run industry supply curve. In the same diagram, draw the market demand curve. This firm’s minimum average variable cost is $4 at 2 units of output. So the firm will produce only if the price is greater than $4, making its individual supply curve the same as its marginal cost curve above the shut-down price of $4. The same is true for all other firms in the industry. That is, if the price is $4, the quantity supplied by all 100 firms is 200. The quantity supplied by all 100 firms at a price of $6 is 300, and so on. The accompanying diagram illustrates this principle. c. What is the market price, and how much profit will each firm make? The quantity supplied equals the quantity demanded at a price of $10 -- the (short-run) market equilibrium price. So the quantity bought and sold in this market is 500 units. Each firm will maximize profit by producing 5 units of output -- the greatest quantity at which price equals or exceeds marginal cost. At 5 units of output, each firm’s revenue is $10 × 5 = $50. Its total cost is $34. So it makes a profit of $16. 14. Suppose there are 1,000 hot pretzel stands operating in New York City. Each stand has the usual U-shaped average-total-cost curve. The market demand curve for pretzels slopes downward, and the market for pretzels is in long run competitive equilibrium. a. Draw the current equilibrium, using graphs for the entire market and for an individual pretzel stand. The figure below shows the current equilibrium in the market for pretzels. The supply curve, S1, intersects the demand curve at price P1. Each stand produces quantity q1 of pretzels, so the total number of pretzels produced is 1,000 × q1. Stands earn zero profit, because price is equal to average total cost. b. The city decides to restrict the number of pretzel-stand licenses, reducing the number of stands to only 800. What effect will this action have on the market and on an individual stand that is still operating? Draw graphs to illustrate your answer. If the city government restricts the number of pretzel stands to 800, the industry-supply curve shifts to S2. The market price rises to P2, and individual firms produce output q2. Industry output is now 800 × q2. Now the price exceeds average total cost, so each firm is making a positive profit. Without restrictions on the market, this would induce other firms to enter the market, but they cannot because the government has limited the number of licenses. c. Suppose that the city decides to charge a fee for the 800 licenses, all of which are quickly sold. How will the size of the fee affect the number of pretzels sold by an individual stand? How will it affect the price of pretzels in the city? No worries here. d. The city wants to raise as much revenue as possible, while ensuring that all 800 licenses are sold. How high should the city set the license fee? Show your answer on your graph. The license fee that brings the most money to the city is equal to (P2 - ATC2)q2, which is the amount of each firm's profit.
